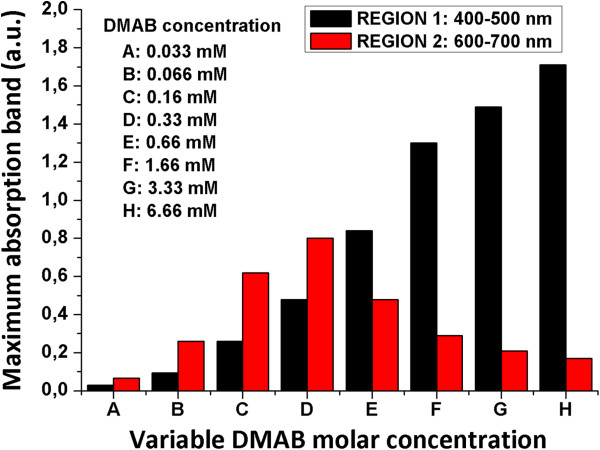
Figure 6.
Evolution of UV–vis maxima absorption bands of silver sols in regions 1 and 2. Absorption bands in regions 1 and 2 are 400 to 500 nm and 600 to 700 nm, respectively. They are prepared with different DMAB concentrations at a constant molar PAA concentration (25 mM) and a constant molar DMAB concentration.

