
Figure 7.
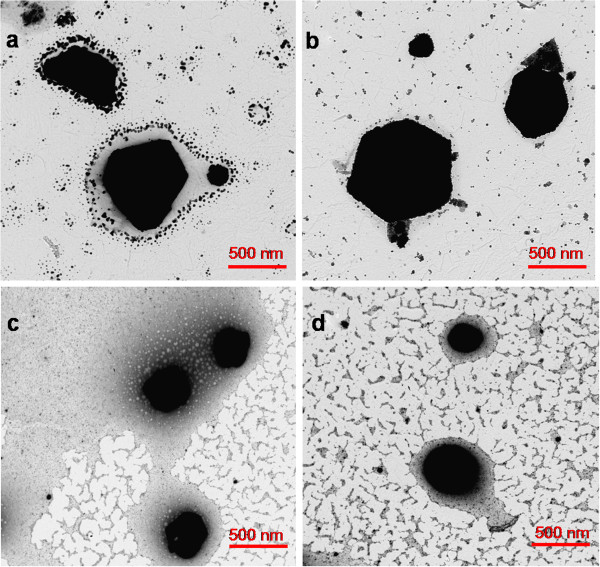
TEM micrographs that show the formation of AgNP with different shapes for different DMAB concentrations. (a) Triangle shape with 0.066 mM DMAB. (b) Hexagonal shape with 0.16 mM DMAB. (c) Quasi-spherical shape with 0.66 mM DMAB. (d) Spherical shape with 3.33 mM DMAB. The PAA concentration was 25 mM.