
Figure 4.
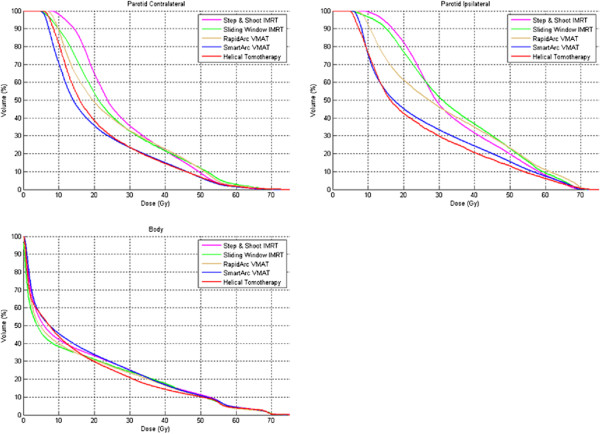
Dose volume histograms of mean values of both parotid glands and total body.
Official websites use .gov
A
.gov website belongs to an official
government organization in the United States.
Secure .gov websites use HTTPS
A lock (
) or https:// means you've safely
connected to the .gov website. Share sensitive
information only on official, secure websites.
Dose volume histograms of mean values of both parotid glands and total body.