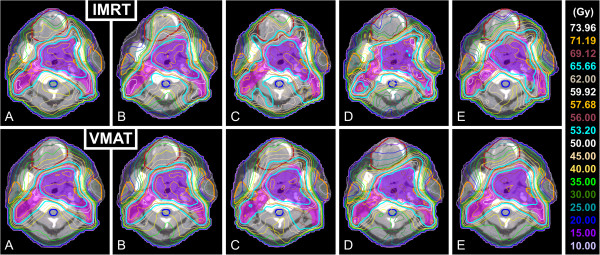
Figure 1.

Dose distributions in a transverse slice for IMRT and VMAT plans of all participating institutes. Dose distributions in a transverse slice for IMRT and VMAT plans prepared by the participating institutes A to E. OARs are depicted with a thick solid line: oral cavity (brown), parotid glands (orange) and spinal cord (blue).
