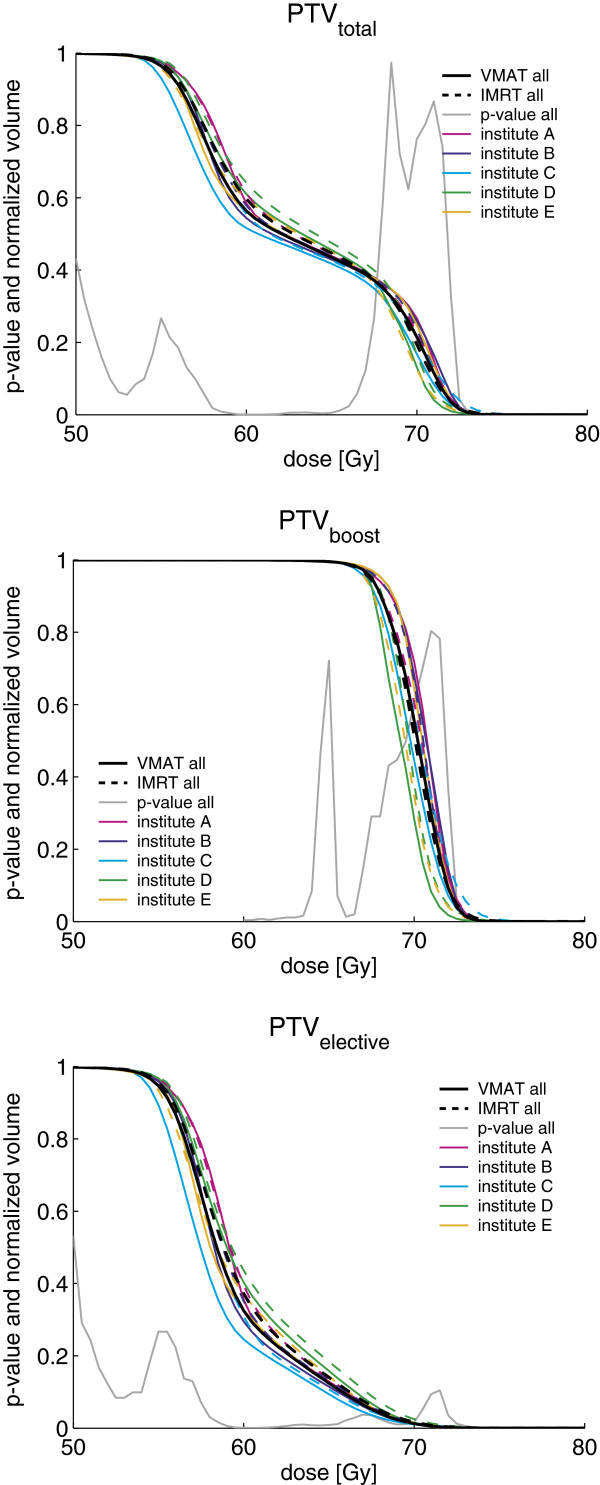
Figure 2.
DVHs for the different PTVs for VMAT and IMRT and p-values for pooled data. DVHs for PTVtotal, PTVboost and PTVelective (= PTVtotal - PTVboost) for VMAT (solid line) and IMRT (dashed line). DVHs are shown for pooled data of all institutes (black) and stratified by institute (colors see legend). The p-values shown were obtained for the pooled data using a paired two-sided Wilcoxon signed rank test.

