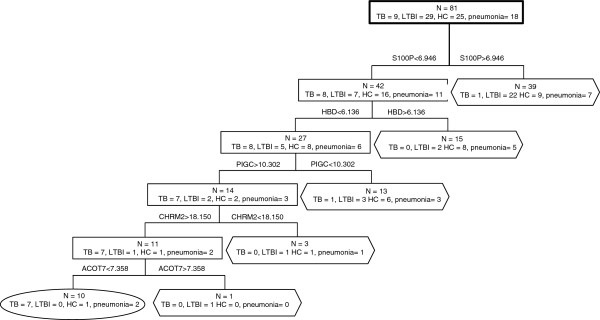
Figure 2.

Decision tree analysis to differentiate TB from LTBI, HC and non-TB pneumonia. The combination of S100P, HBD, PIGC, CHRM2 and ACOT7 provides the best discrimination between TB, LTBI, HC and non-TB pneumonia. The sensitivity and specificity of this five-gene panel was 78% and 96% respectively. 94% of the children were correctly classified. Rectangle: internal nodes; Oval and hexagon: terminal nodes showing the number finally determined as TB and non-TB (LTBI, HC or non-TB pneumonia).
