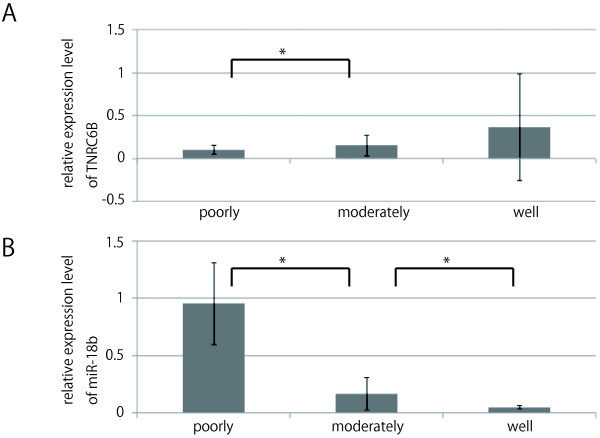
Figure 2.
Expression pattern of TNRC6B and miR-18b according to the histological differentiation. Expression pattern of TNRC6B and miR-18b according to the degree of histological differentiation by real-time qPCR. Each column represents the relative amount of TNRC6B normalized to the expression level of β-actin or the relative amount of miR-18b normalized to the expression level of U18. The data shown are means ± SD of three independent experiments. Asterisk indicates a significant difference (p < 0.05).

