
Fig. 4.
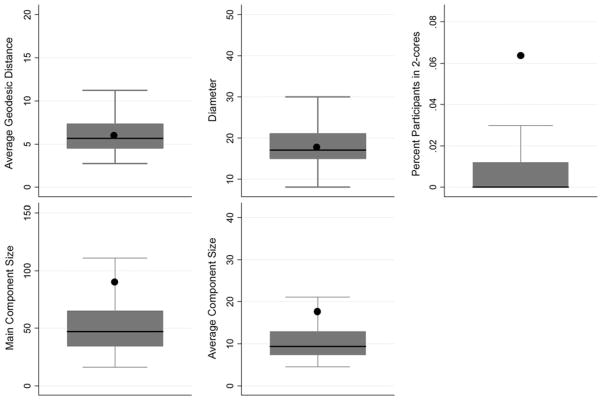
Boxplots of indexes computed from 1,000 random generated networks (n = 503) with observed network (n = 503) indicated by the symbol black circle. Note Boxplots for centralization and transitivity were unable to be constructed due to lack of variance in values generated from the random networks