Figure 10.

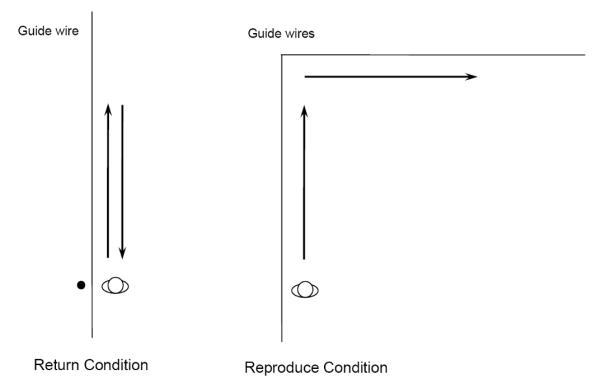
Diagram depicting the setup in Experiment 3 (top view). The lines represent the guide wire, along which the participants walked. The black circle represents a pole at the starting position of the return condition.

Diagram depicting the setup in Experiment 3 (top view). The lines represent the guide wire, along which the participants walked. The black circle represents a pole at the starting position of the return condition.