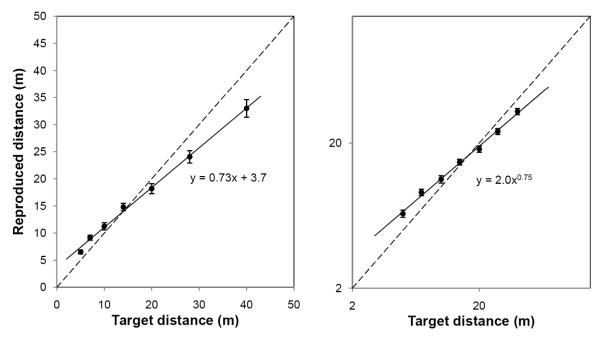
Figure 11.
The reproduced distance as a function of the target distance in Experiment 3. The data are collapsed across walking directions because these did not differ. The same data are plotted in both linear space (left) and logarithmic space (right). Best fitting lines in each space are shown. Standard errors are shown.

