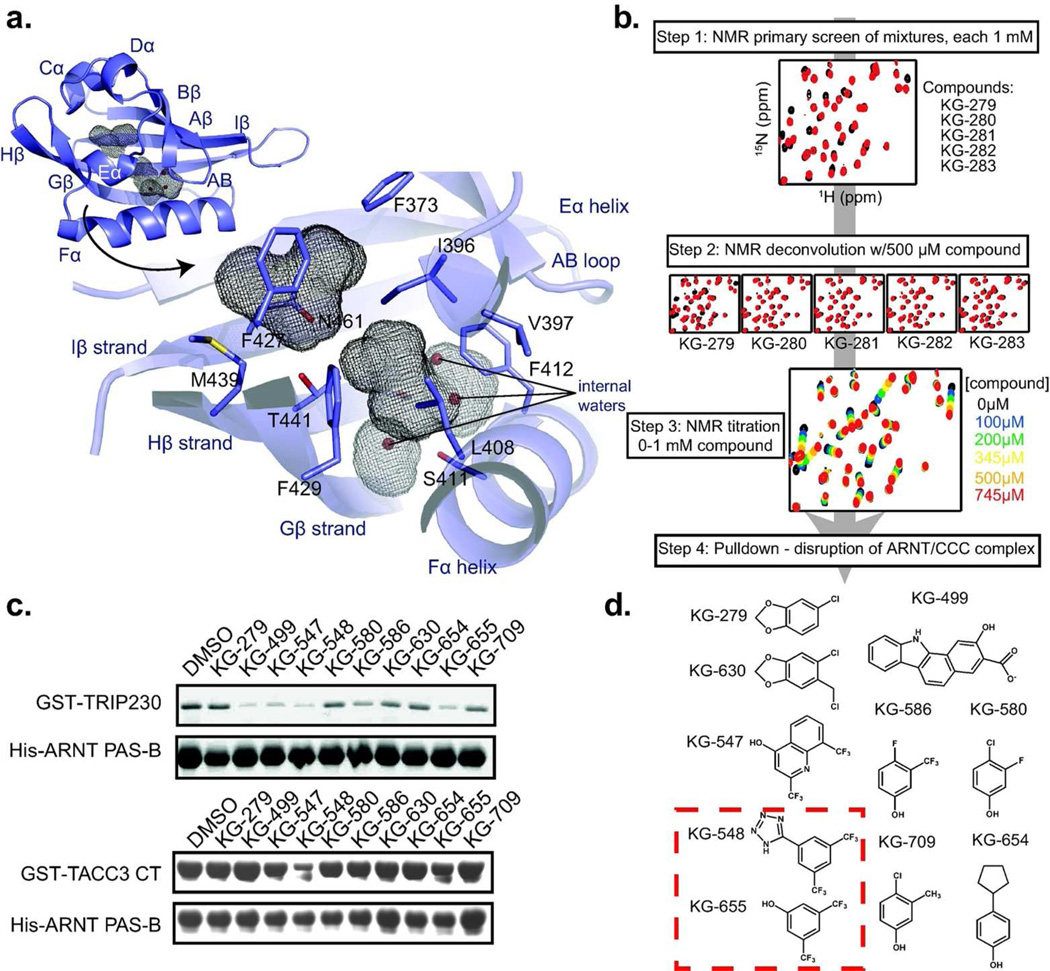
Figure 2. Screening ARNT PAS-B for small molecule effectors of the ARNT/TACC3 interaction.
a. Diagram of the ARNT PAS-B crystal structure, shown inset with secondary structure designations and internal cavities (grey mesh). The larger cavity is adjacent to the TACC3 binding site and contains three waters; the.smaller cavity is primarily hydrophobic. b. Schematic of the NMR-based screen for compounds that bind ARNT PAS-B. Initial 15N/1H HSQC spectra were acquired with 250 µM 15N-labeled ARNT PAS-B with a mixture of five compounds (1 mM each); mixtures producing large chemical shift perturbations (compared to DMSO) were deconvoluted as shown. c. Lead compounds (500 µM each) from NMR-based screen were tested for their ability to disrupt complexes of ARNT PAS-B with CCC fragments of TRIP230 (1583–1716) and TACC3 (561–631 = TACC3-CT). d. Summary of ARNT PAS-B binding and ARNT/CCC disruption of tested compounds. All ten compounds generated chemical shift perturbations when titrated into ARNT PAS-B; KG-548 and KG-655 (red box) also disrupted TRIP230 and TACC3 binding to ARNT PAS-B in vitro.

