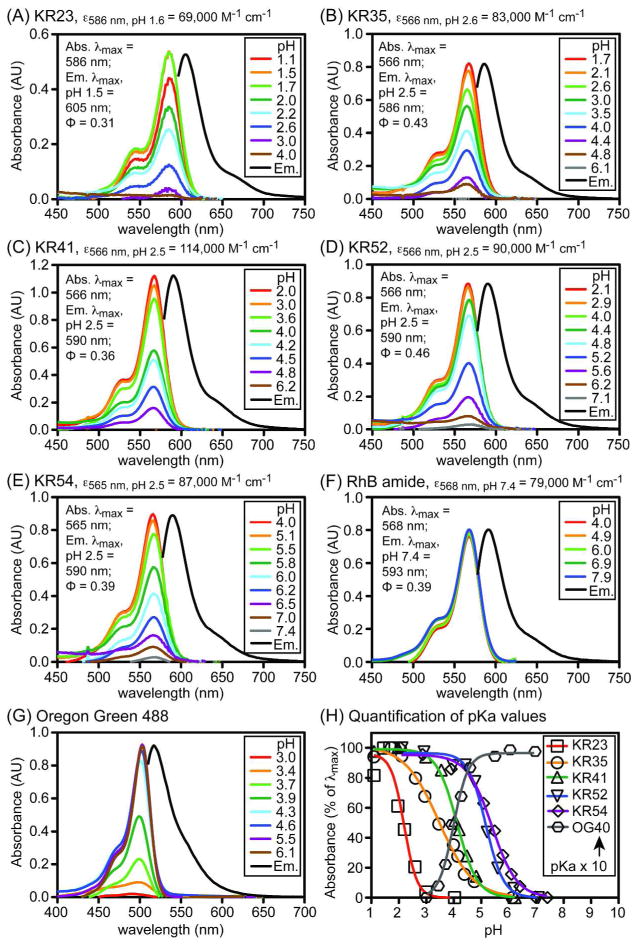
Figure 2.
Spectral properties of the Kansas Red fluorophores and control compounds. Panels A–G: Absorbance spectra of compounds (10 μM) acquired in simulated gastric fluid comprising aqueous buffer containing BSA (1%), Triton X-100 (1%), and DMSO (1%) at the pH values shown. Fluorescence emission spectra (Em.), obtained in phosphate (10 mM) buffers (pH 1.5 for KR23 and pH 2.5 for KR35-KR54 fluorophores) containing Triton X-100 (1%), normalized to 100% of the abs. λmax peak. Panel H: Quantification of pKa values from absorbance measurements. OG40: Oregon Green 488 fluorophore with pKa = 4.0 in simulated gastric fluid. Relative quantum yields of acid-activated fluorophores were determined in ethanol containing 1% TFA. Data used to calculate extinction coefficients and quantum yields is provided in the supporting information.

