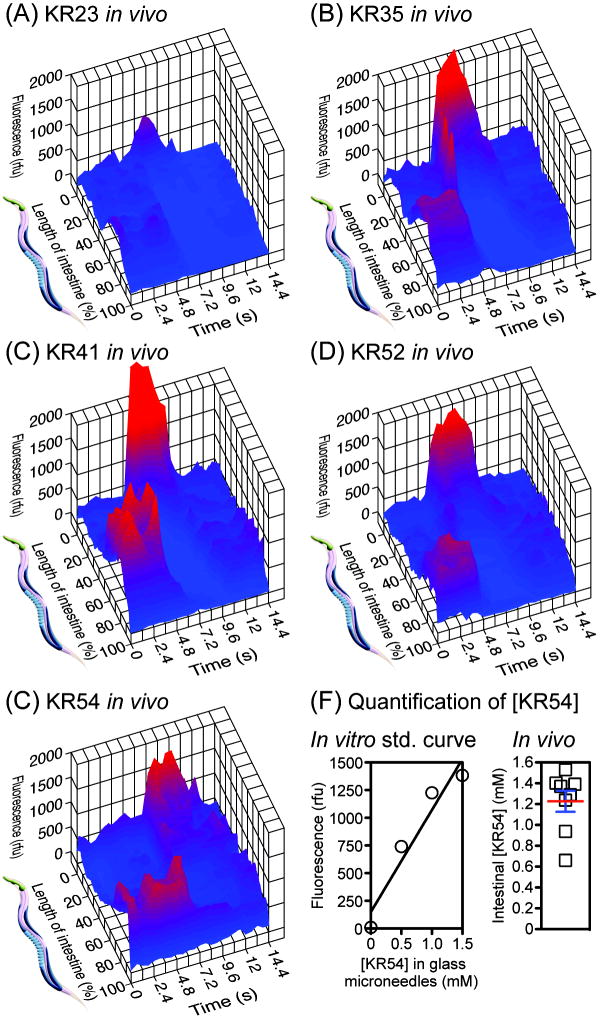
Figure 5.
Panels A–E: Three-dimensional plots of changes in fluorescence in the intestine of unrestrained C. elegans during the DMP. Single frames isolated from video microscopy were normalized and analyzed after animals fed on media containing KR23, KR35, KR41, KR52, or KR54 (10 μM, 0.1% DMSO) for 30 min. Maximum anterior fluorescence was observed at t ~ 7.2 s. Each plot represents analysis of a single animal. Panel F, left: Fluorescence standard curve constructed by imaging of KR54 in glass microneedles, pulled to an internal diameter of 15 microns, filled with this fluorophore in aqueous solution (pH 2.5) containing BSA (1%), Triton X-100 (1%), and DMSO (10%). This elevated concentration of DMSO (10%) facilitated solubility of the fluorophore at high (e.g. mM) concentration in needles. Panel F, right: Quantification of the concentration of KR54 in the lumen of the posterior intestine, between DMP cycles, assuming an intestinal pH of 4.4. Each data point represents analysis of a single animal (mean ± SEM shown).

