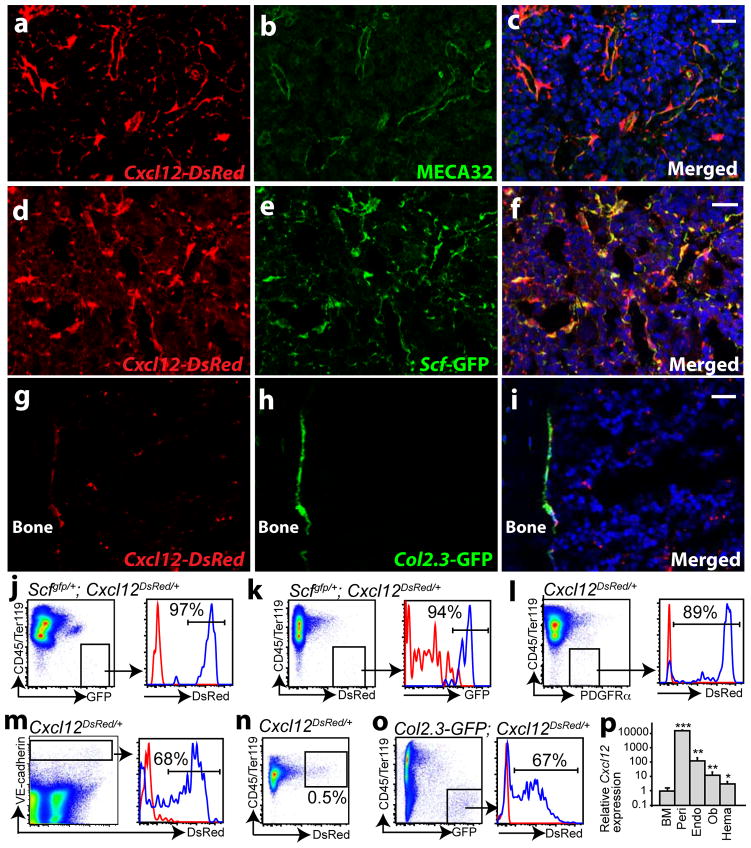
Figure 1. Endothelial cells and perivascular stromal cells are the major sources of Cxcl12 in bone marrow.
a–c, In Cxcl12DsRed/+ mice, DsRed was primarily expressed by perivascular cells throughout the bone marrow. d–f, Cxcl12-DsRed and Scf-GFP expression strongly overlapped around sinusoids throughout the bone marrow of Scfgfp/+; Cxcl12DsRed/+ mice. g–i, Col2.3-GFP+ bone-lining osteoblasts expressed Cxcl12-DsRed in the bone marrow of Col2.3-GFP+; Cxcl12DsRed/+ mice. Nuclei were stained with 4′, 6-diamidino-2-phenylindole (DAPI, blue) in c, f and i. j, CD45/Ter119−Scf-GFP+ perivascular stromal cells expressed Cxcl12-DsRed in Scfgfp/+; Cxcl12DsRed/+ (blue histogram) but not in Scfgfp/+ control marrow (red histogram). k, CD45/Ter119−Cxcl12-DsRedhigh cells expressed Scf-GFP in Scfgfp/+; Cxcl12DsRed/+ (blue) but not in Cxcl12DsRed/+ control marrow (red). l, CD45/Ter119−PDGFRα+ perivascular stromal cells expressed Cxcl12-DsRed in Cxcl12DsRed/+ (blue) but not control (+/+; red) marrow. m, VE-cadherin+ endothelial cells expressed Cxcl12-DsRed in Cxcl12DsRed/+ (blue) but not control (+/+; red) marrow. n, 0.5% of CD45/Ter119+ haematopoietic cells expressed Cxcl12-DsRed in Cxcl12DsRed/+ but not in control marrow (Supplementary Fig. 1g). o, CD45/Ter119−Col2.3-GFP+ osteoblasts from enzymatically dissociated bone expressed Cxcl12-DsRed in Col2.3-GFP; Cxcl12DsRed/+ (blue) but not Col2.3-GFP control (red) mice. p, Cxcl12 transcript levels by qRT-PCR in different subpopulations of bone marrow cells (n=3–6). BM, whole bone marrow cells. Peri, EYFP+ perivascular stromal cells from Lepr-cre; loxpEYFP mice. Endo, VE-cadherin+ bone marrow endothelial cells. Ob, Col2.3-GFP+ osteoblasts. Hema, CD45/Ter119+Cxcl12-DsRed+ haematopoietic cells. All data represent mean±s.d. from at least three independent experiments. Two-tailed student’s t-tests were always used to assess statistical significance (*P<0.05, **P<0.01, ***P<0.001). Scale bars are 20 um.

