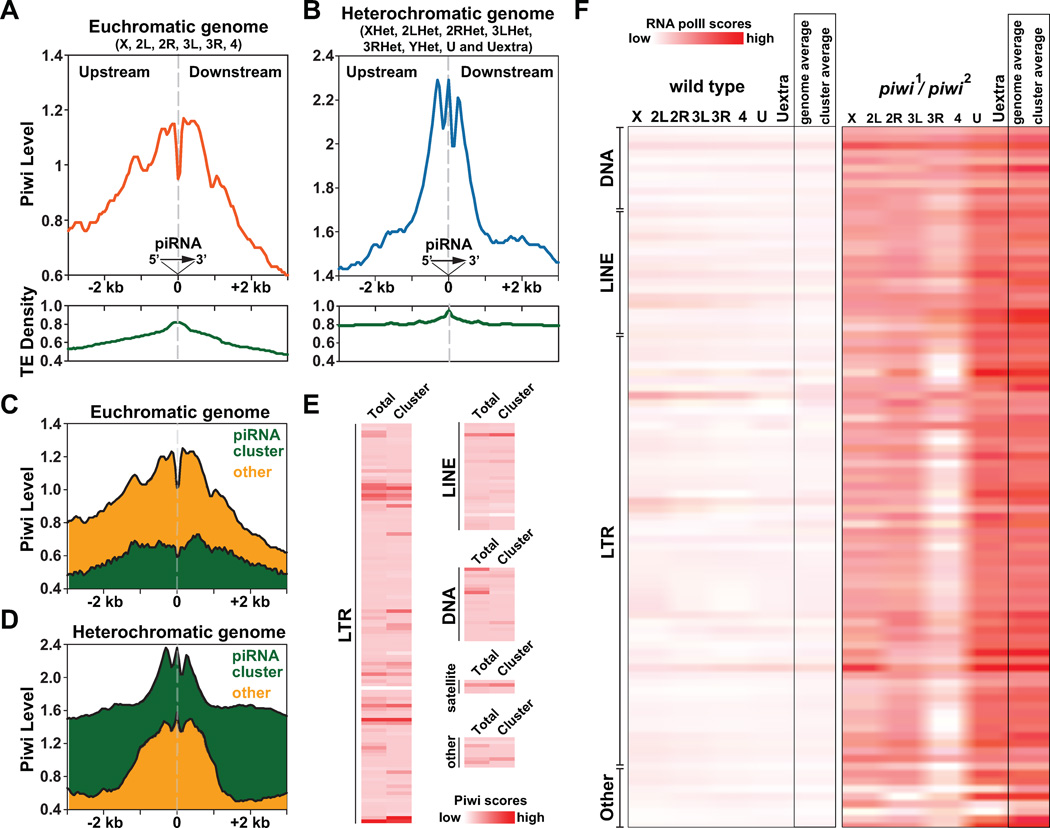
Figure 6. Distinct co-localization patterns of Piwi and Piwi-associated piRNAs in euchromatin and heterochromatin suggest two modes of Piwi-piRNA guidance mechanism.
(A–B) Relative positions of Piwi, Piwi-associated piRNA and transposons within euchromatic genome (X, 2L, 2R, 3L, 3R, 4) and heterochromatic genome (XHet, 2LHet, 2RHet, 3LHet, 3RHet, YHet, U and Uextra). Piwi-associated piRNAs were aligned at their 5' ends in the same direction. Grey dash lines indicate positions of piRNAs. Piwi ChIP-Seq scores within upstream and downstream regions surrounding piRNA-transcribing regions (± 3-kb) were separately plotted for euchromatic genome (orange) and heterochromatic genome (blue), together with the transposon density (TE density; green). See also Figures S4.
(C–D) Relative positions of Piwi with piRNAs derived from piRNA clusters (green) and other sporadic piRNAs (orange).
(E) Heat maps depict Piwi ChIP-Seq scores over various types/classes of transposons within genome. Average Piwi ChIP-Seq scores of all same types of transposons within genome (total) or only within piRNA clusters (cluster) were separately calculated.
(F) Heat maps depicts levels of chromatin-associated RNA Pol II over various types/classes of transposons within wildtype flies (left) and piwi1/piwi2 mutants (right). Average RNA Pol II ChIP-Seq scores were separately calculated for all same types of transposons on chromosomal arms (X, 2L, 2R, 3L, 3R, 4), on contigs (U, Uextra) as well as for all same types of transposon within genome (genome average) or within piRNA clusters (cluster average).

