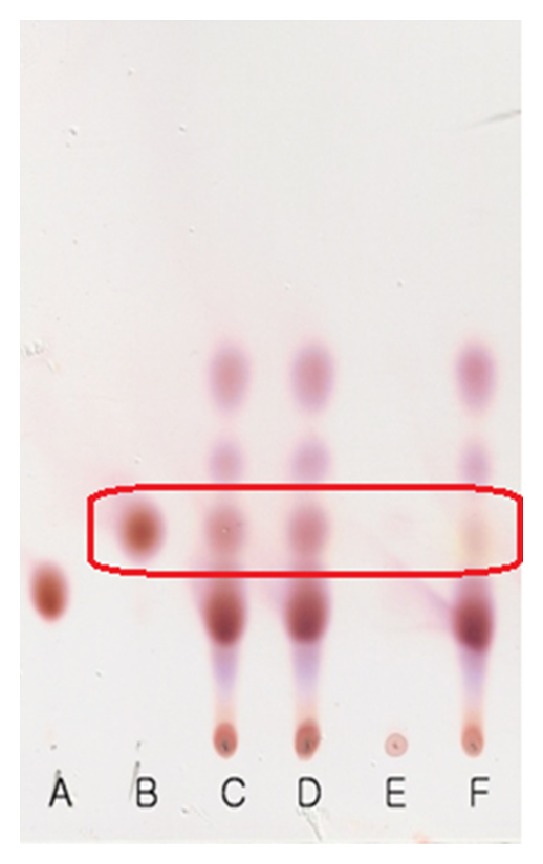
Figure 5.

TLC analysis of GABA in the culture medium and cytoplasmic fraction of L. plantarum LG42 cells. A: spot of standard MSG; B: spot of standard GABA; C–E: spots of cell culture medium (C), cell-free supernatant (D), and cytoplasmic fraction of cells (E) cultured in MRS broth with 1% MSG; F: spot of cell culture medium cultured without added MSG.
