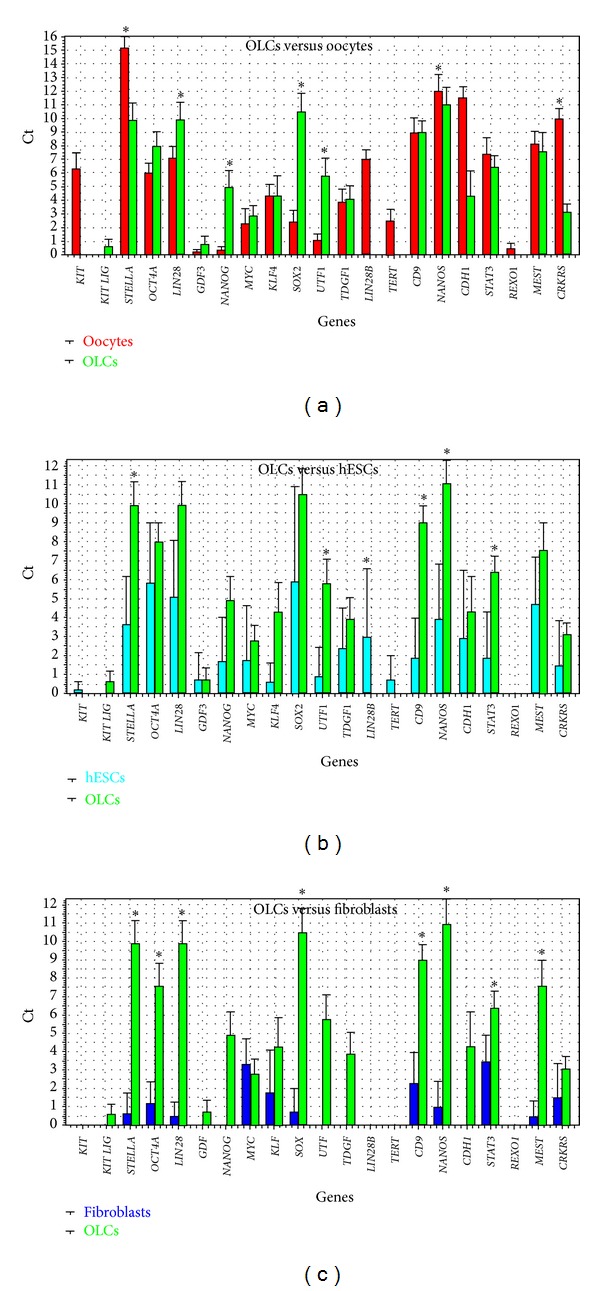
Figure 6.

Descriptive statistics of the expression of genes (Ct values), characteristic of pluripotent stem cells in primitive oocyte-like cells (OLCs), developed in vitro. (a) Comparison with oocytes. (b) Comparison with hESCs. (c) Comparison with fibroblasts. Cell group colours: green: oocyte-like cells, developed in vitro, red: oocytes from the in vitro fertilization programme, and dark blue: fibroblasts. Legend: *Statistically significant difference at P < 0.00244 (Dunn-Bonferroni correction), as revealed using the two-tailed Mann-Whitney test.
