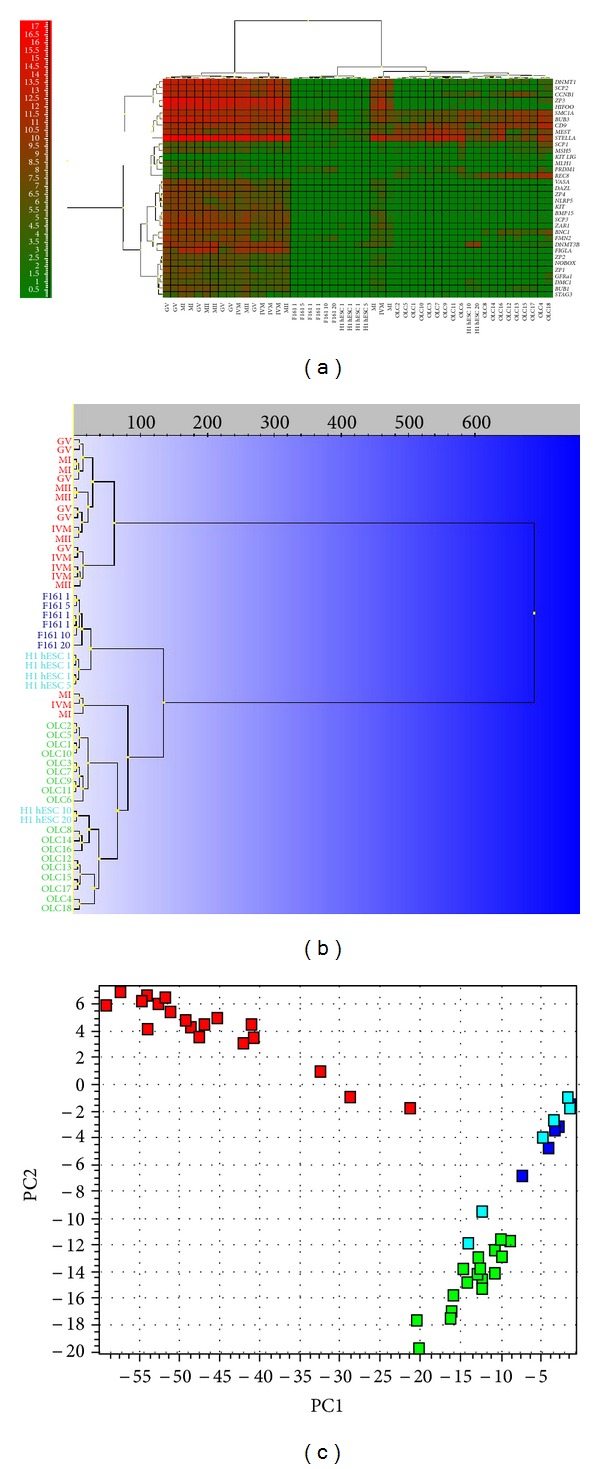
Figure 7.

Single-cell gene expression profile of oocyte-specific genes in primitive oocyte-like cells developed in vitro (OLCs). Comparison with human embryonic stem cells (H1 hESCs), nonfertilized oocytes from the in vitro fertilization programme (O) and fibroblasts (F161) revealed the expression of several oocyte-specific genes in oocyte-like cells. (a) Heatmap clustering. (b) Hierarchical clustering. (c) Principle component analysis (PC1 versus PC2). Legend of analyzed cells:OLC(1–18): oocyte-like cells developed in vitro; O: oocytes; H1 hESC: human embryonic stem cells of line H1 (1: one cell, 5: five cells, 10: ten cells, and 20: twenty cells); F161: fibroblasts of F161 line.
