
Figure 1.
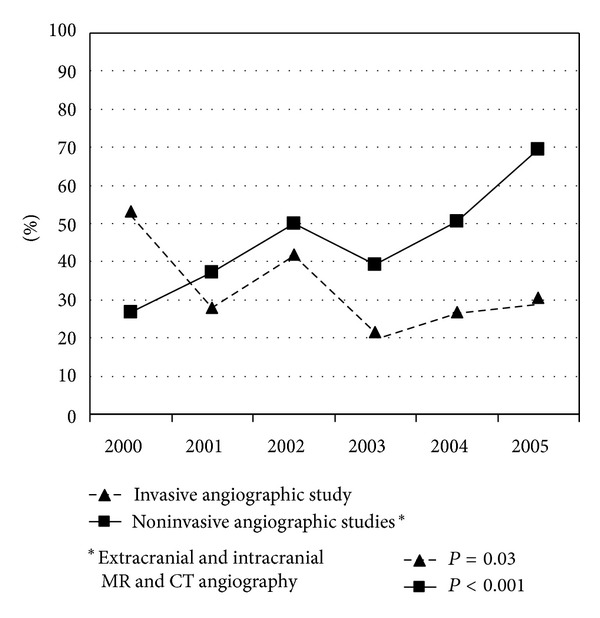
Changes over time (2000–2005) of the frequency of angiographic studies.
Official websites use .gov
A
.gov website belongs to an official
government organization in the United States.
Secure .gov websites use HTTPS
A lock (
) or https:// means you've safely
connected to the .gov website. Share sensitive
information only on official, secure websites.
Changes over time (2000–2005) of the frequency of angiographic studies.