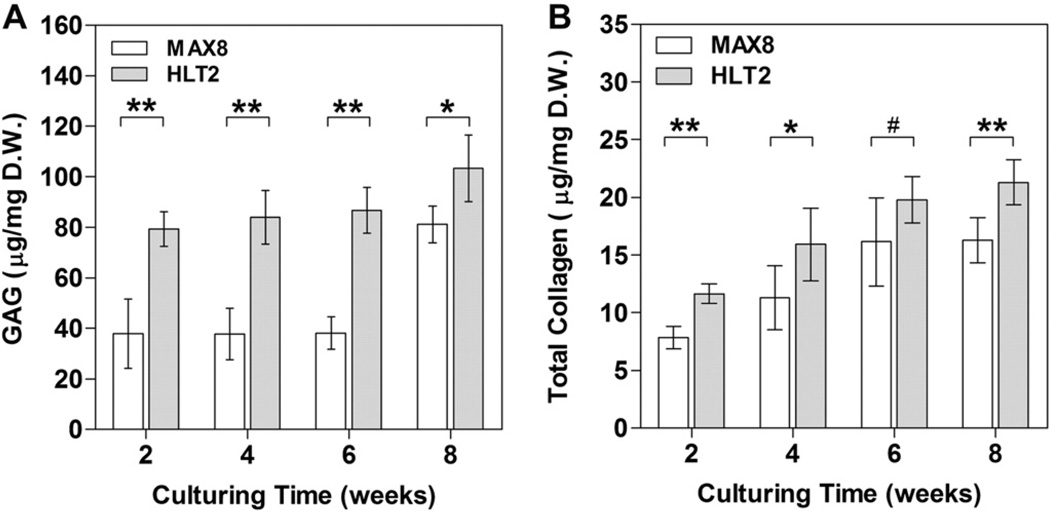
Fig. 3.
Quantitative analysis of (A) glycosaminoglycan content and (B) total collagen content for MAX8 and HLT2 gel-cell constructs as a function of time normalized to construct dry weight. Error bars represent the standard deviation of 3–6 constructs. Statistical differences were assessed by a two-tailed unpaired t-test; # = not-significant, *p < 0.05, **p < 0.01.

