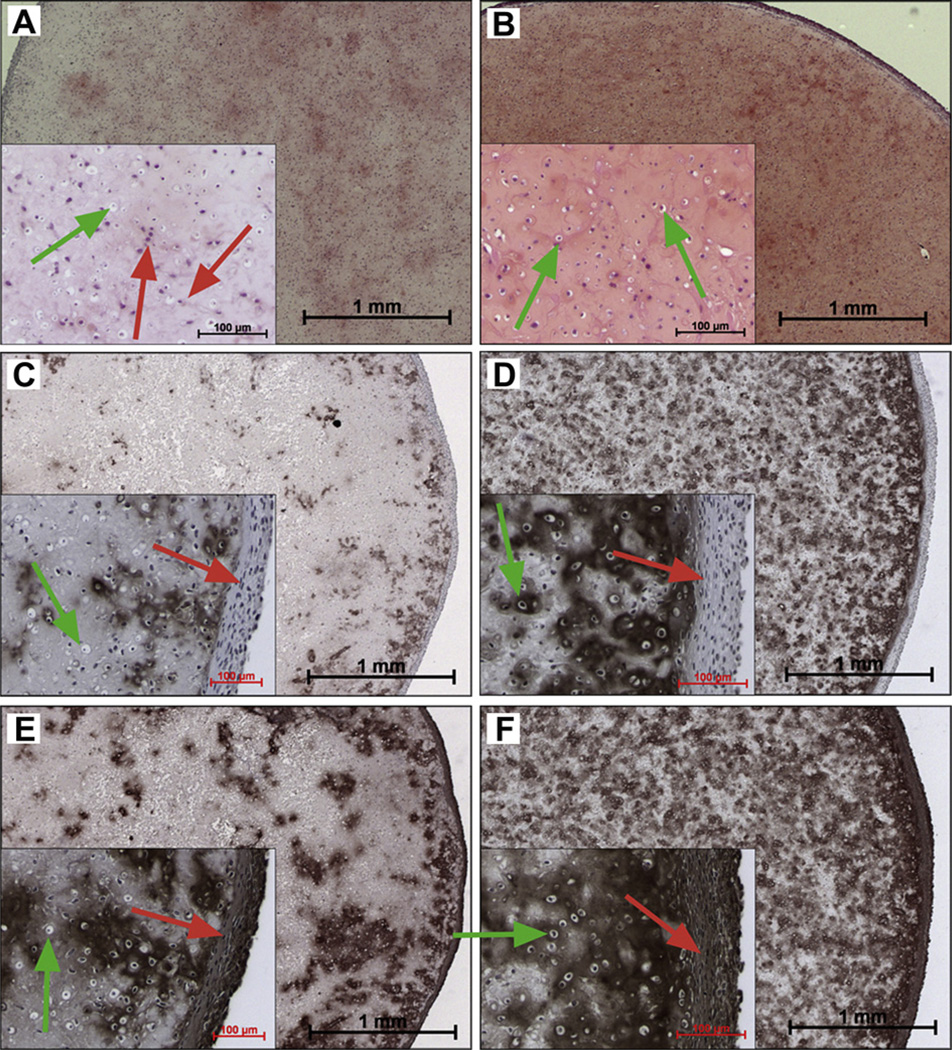
Fig. 4.
Histological assessment of 8-week MAX8 gel-cell constructs (A, C, E) and HLT2 gel-cell constructs (B, D, F). Panels A and B show GAG accumulation (red, safranin-O). Panels C and D show type II collagen accumulation (brown, IHC). Panels E and F shown type I collagen accumulation (brown, IHC). Insets represent magnified areas highlighting cell morphology (green arrows = round chonrocytic cells, red arrows = fibroblastic-like cells). Cell nuclei are stained purple/blue (hematoxylin). Scale bar = 1 mm, inset scale bar = 100 µm. (For interpretation of the references to colour in this figure legend, the reader is referred to the web version of this article.)

