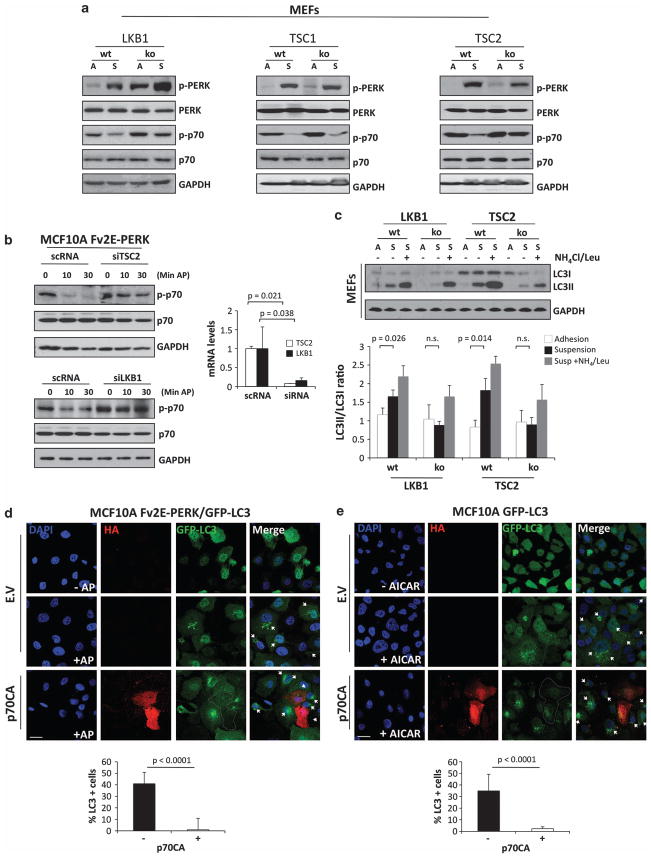
Figure 3.
LKB1 and TSC2, but not TSC1, are required for suspension-induced inhibition of mTORC1 signaling. (a) Lysates of LKB1 +/+, LKB1 −/− and TSC2 +/+, LKB1 −/− MEFs were collected from attached (A) and suspended (S) conditions, and immunoblotted (IB) against the indicated antigens. (b) MFC10A Fv2E-PERK cells were transfected with TSC2 (upper panel), LKB1 (lower panel) siRNAs or scramble control (scRNA), and treated with or without 100 pM AP at the indicated time points (min) and IB against the indicated antibodies (Abs). Right graphs show TSC2 and LKB1 knocking down controls by mRNA transcript level analysis normalized to glyceraldehyde 3-phosphate dehydrogenase (GAPDH). (c) Adhered (A) or suspended (S) LKB1+/+, LKB1−/− and TSC2+/+, LKB1−/− MEFs were treated with 0.1 Leupeptin and 20 mM NH4 as indicated and analyzed by IB for the indicated antigens. Densitometric analysis for LC3 flux was determined using Image J software (N = 3). (d, e) Images showing adhered Fv2E-PERK/GFP-LC3 (d) or GFP-LC3 (e) MCF10A cells transfected with empty vector (EV) or p70S6K mutant Δ2-46 ΔCT104 (p70CA) for 48 h and treated with or without AP (d) or AICAR (e) for 4 h. After that, cells were fixed and stained with anti-HA antibodies for p70CA expression. Lower graphs, percentage of LC3-positive (five or more puncta/cell) cells were scored (n = 50) and plotted in the p70CA- and EV- (see Supplementary Figure 1F) transfected cells. Scale bars indicate 10 μm. P-values were determined by the Student’s t-test.

