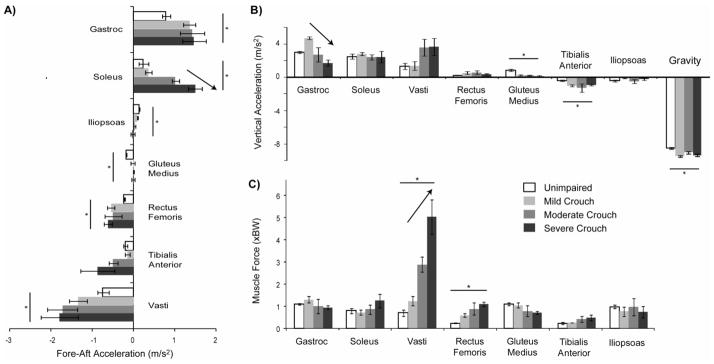
Figure 3.

The average (A) fore-aft and (B) vertical accelerations of the mass center during stance produced by each muscle and (C) the average muscle force during stance normalized by body weight (BW). Error bars are ± 1 standard error. A ‘*’ indicates a significant difference (p < 0.05) in the student’s t-test comparing unimpaired gait and crouch gait. An arrow indicates a significant change with crouch severity (p < 0.05) from a one-way ANOVA comparing mild, moderate, and severe crouch gait. In (B), ‘Gravity’ indicates the acceleration of the mass center when only gravity is applied to the mass center. The vertical acceleration provided by skeletal alignment is equal to 9.81 m/s2 minus ‘Gravity.’
