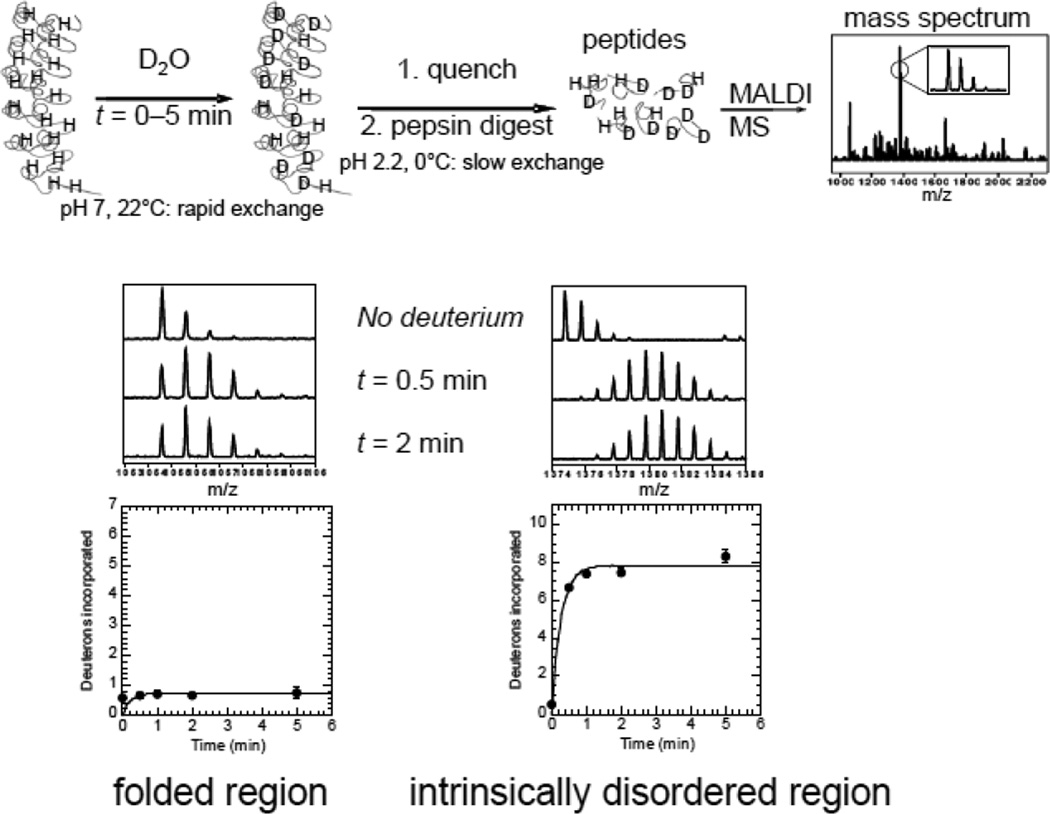
Figure 1.
Schematic diagram of the HXMS experiment used to discover intrinsically disordered protein regions. A generic example is given of a repeat protein for which the structure was known only when the protein was in complex with its binding partner. Intrinsic disorder is readily characterized by rapid amide exchange after only a few minutes. There is some residual deuteration at t=0 due to the experimental set-up. The data were fitted to single or double exponential equations. Typically, the rate of the first exponential was set to 30 s−1 and the second exponential as well as the amplitude of each exponential phase were fitted parameters. The amplitude (number of amides exchanging) of the rapidly exchanging group can be taken as approximately the number of amides exchanging at the intrinsic rate.

