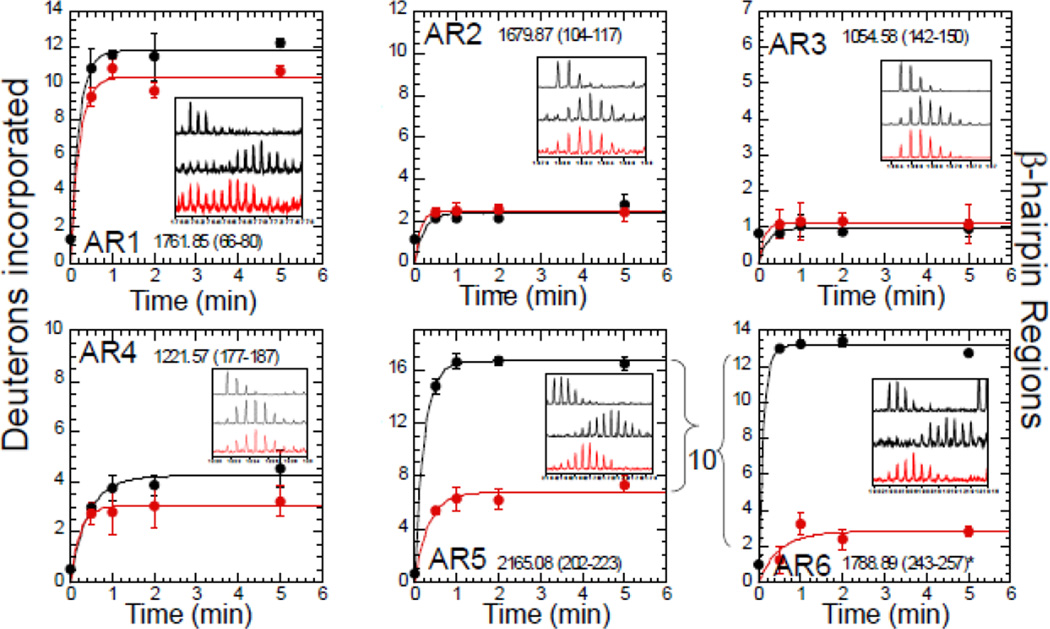
Figure 3.
Example of how HXMS data can reveal a coupled folding and binding event. Each panel shows the HXMS data from one of the six β-hairpins of IκBα in the free state (black symbols) compared to the NFκB-bound state (red symbols). It can be seen that the folded regions (from repeats 2, 3, and 4) do not change much upon binding whereas the intrinsically disordered regions (AR5–6) exchange completely in the free state, but in the bound state their exchange resembles that of the folded ARs 2, 3, and 4. The data are from Truhlar et al., (2006) 57.

