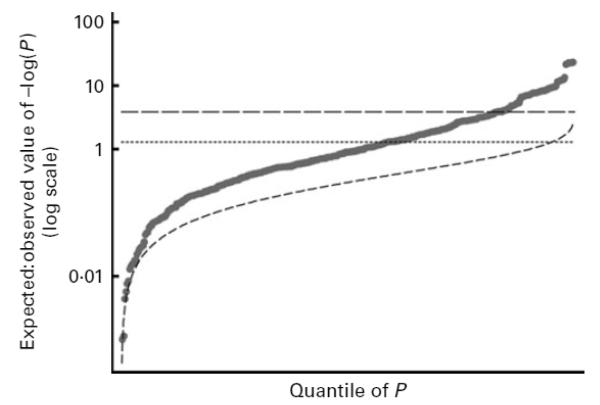
Fig. 1.
Q-Q plot of 374 multivariable genetic comparisons (11 fatty acid outcomes × 17 genetic variants × mother/offspring) reported in Tables 3 and 4. The graph shows the distribution of the observed ranked P values (●; least significant to the most highly significant) and the expected distribution if all 374 comparisons were null (––). At the 5% level (----), 154 (41 %) results were significant while, using the Bonferroni adjustment (---), sixty-three (17%) were significant. The false discovery rate (FDR) criterion will always lie between these two extremes, with its precise value depending on the observed distribution. For these data, the FDR criterion was calculated as 0-0163.

