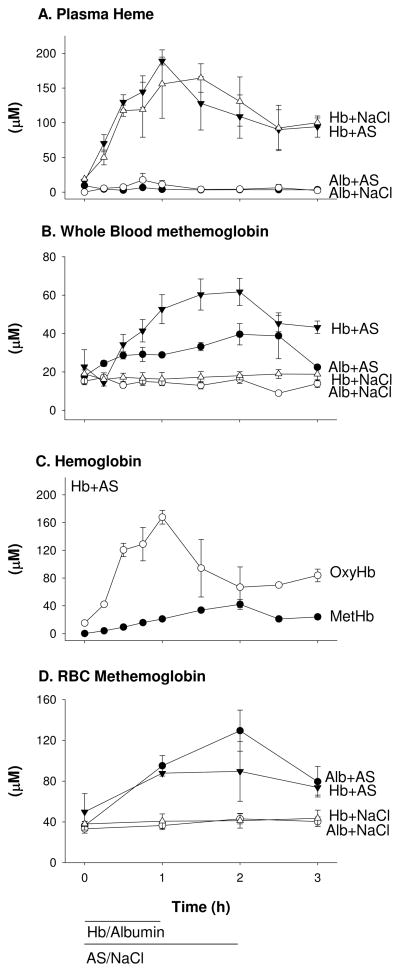
Figure 2.
Hemoglobin concentrations and species. (A) Total plasma heme levels in animals co-infused with cell-free Hb and AS, cell-free Hb and NaCl, Alb and AS, Alb and NaCl determined by absorption spectroscopy and spectral deconvolution fitting. (# of data points analyzed at a given treatment time point; n=3 for 23, n=2 for 9, and n=1 for 4). (B) Whole blood metHb levels in animals receiving the above infusions determined by EPR spectroscopy. (# of data points analyzed at a given treatment time point; n=3 for 26, n=2 for 8, and n=1 for 2) (C) Plasma Hb specie levels in animals co-infused with AS and cell-free Hb. MetHb was determined by EPR spectroscopy. (# of data points analyzed at a given treatment time point; n=3 for 24, n=2 for 10, and n=1 for 2). OxyHb was determined as the difference between total plasma Hb and metHb, confirmed by spectral deconvolution. Some samples were lost due to contamination or EPR tube breakage. (D) Average intra-erythrocytic (RBC) metHb levels in animals receiving the above 4 infusions. The error bars report the standard error of the mean.

