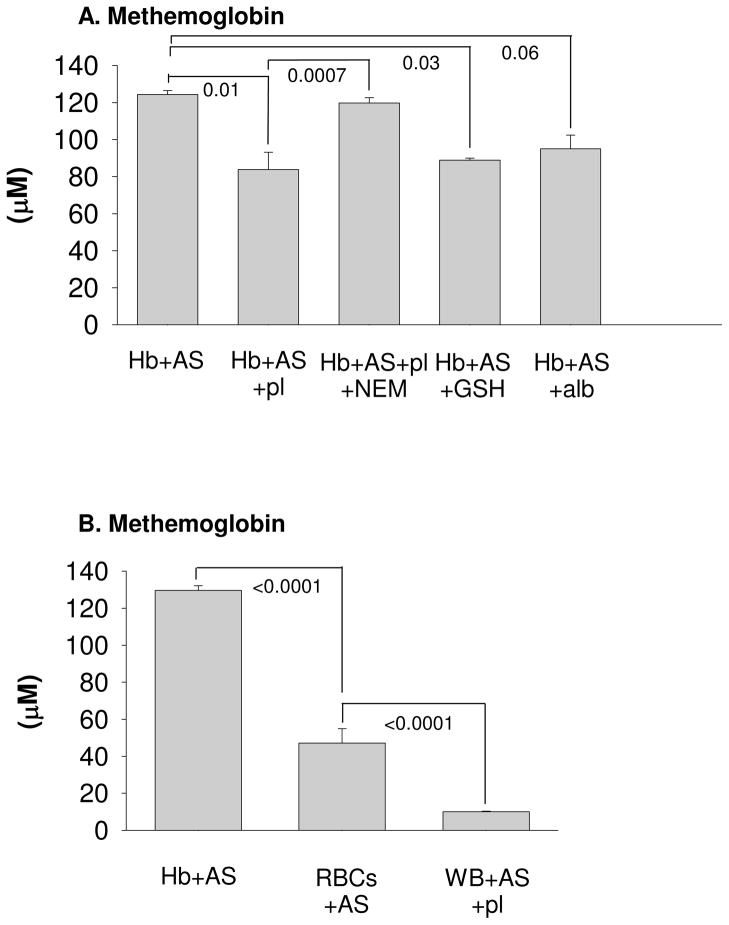
Figure 3.
In vitro experiments designed to examine low metHb yields in vivo. MetHb formation, determined by EPR spectroscopy or absorption spectroscopy, was due to infusion of AS (50 μM) added to: (A) oxyHb (1mM) diluted in phosphate buffered saline, oxyHb (1mM) diluted in plasma, oxyHb (1 mM) diluted in plasma that was incubated with NEM (10 mM) for 1 hour at 37°C prior to mixing with oxyHb, oxyHb (1mM) + GSH (10 mM), and oxyHb (1 mM) + bovine serum albumin (5g/dL, ~750 μM). Error bars represent one standard deviation, n=3. (B) AS (50 μM) added to: oxyHb (1 mM), red blood cells (1mM) diluted in phosphate buffered saline, and whole blood (1mM) diluted in plasma. Concentrations were determined by EPR spectroscopy after incubation for 2 hours at 37°C. Error bars report the standard error of the mean, n=3.

