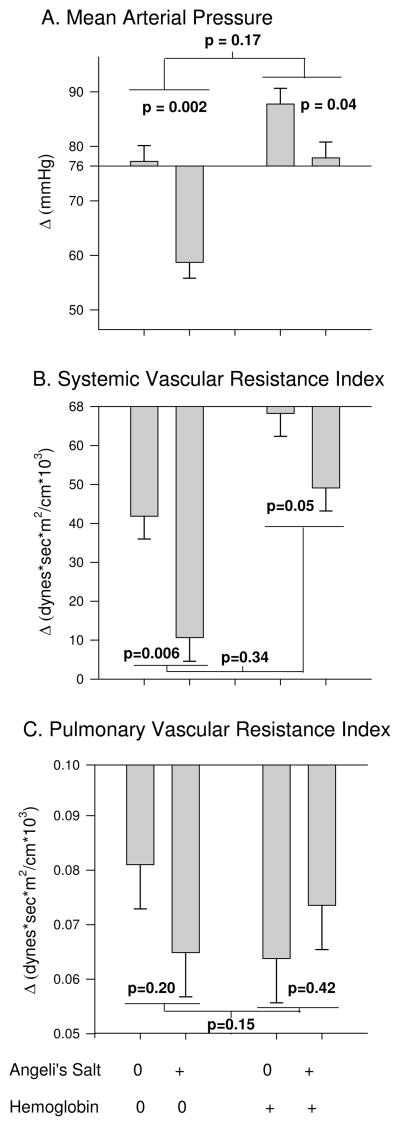
Figure 5.
Systemic and Pulmonary Pressures. A) mean arterial pressure, B) systemic vascular resistance index, C) pulmonary vascular resistance index (+/− standard error). The p value over each bar pair shows the effect of AS, the average difference from baseline over the course of the 3h experiment, compared to NaCl (AS control). The bar pair on the left shows the effects of AS in the absence of Hb (Alb as control) and on the right shows the effects of AS in the presence of plasma Hb. The p-value in the middle represents if there is a significant difference between the effect of AS in the presence of Hb vs. in the absence of plasma Hb (interaction effect).

