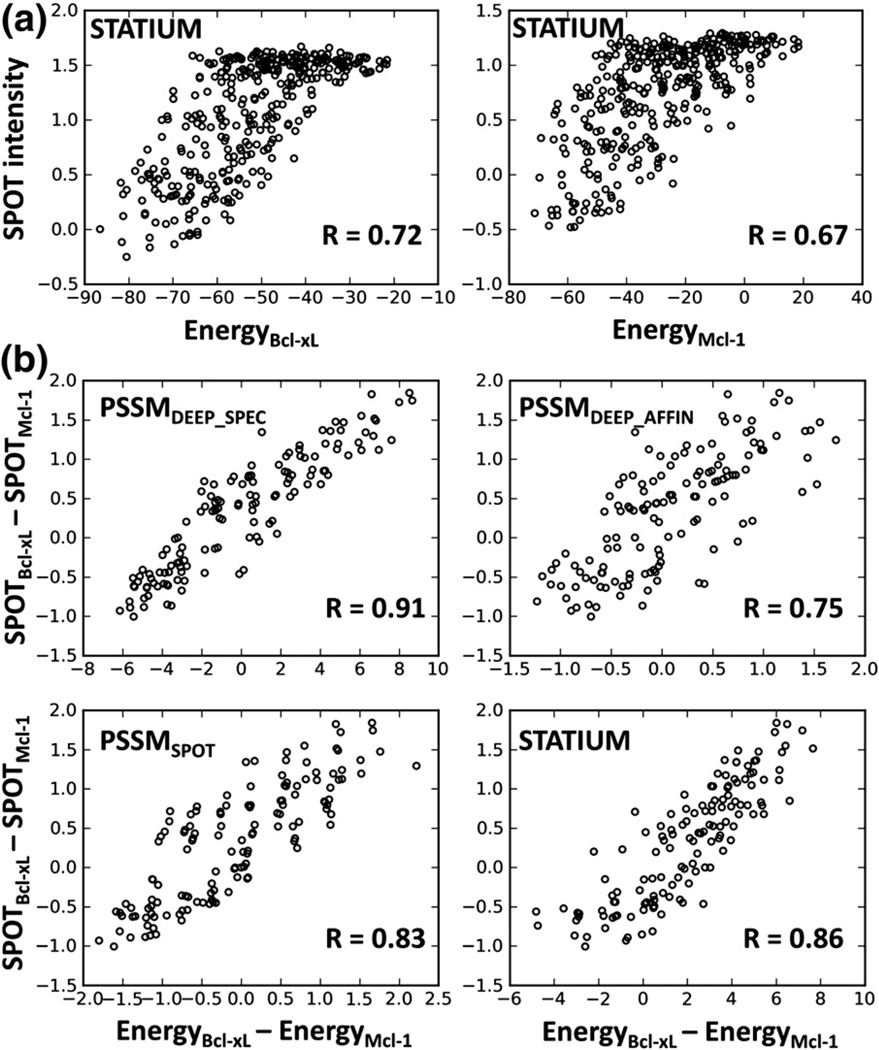
Fig. 3.
Correlation of SPOT library signals with predicted values. (a) Intensities expressed as −log(SPOT/SPOTWT) for library variants binding to Bcl-xL or Mcl-1 are correlated with the STATIUM energy scores for Bcl-xL or Mcl-1 binding. (b) Differences in SPOT signals for Bcl-xL and Mcl-1 versus differences in the Bcl-xL and Mcl-1 scores from various models, for strong binders on the library arrays. The model tested is indicated in each panel. Bootstrapping analysis gave 90% confidence intervals as follows: PSSMDEEP_SPEC, 0.89–0.94; PSSMDEEP_AFFIN, 0.69–0.8; PSSMSPOT, 0.80–0.87; and STATIUM, 0.82–0.89.

