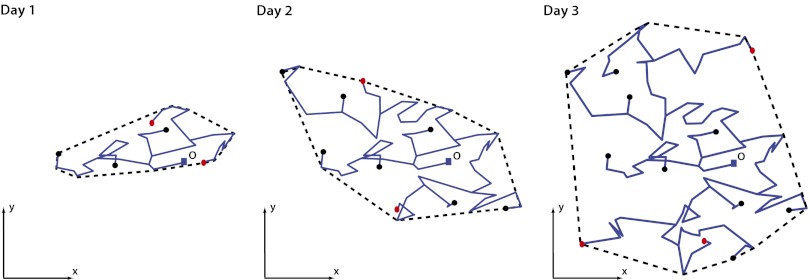
Fig. 1.
The snapshots of the trajectories of an assembly of infected individuals at the epidemics outbreak at three different times (schematic) starting from a single infected at the origin O at time t = 0.Individuals that are still infected at a given time t are displayed as red dots, whereas individuals already recovered are shown as black dots. The convex hull enclosing the trajectories (shown as a dashed line) is a measure of the geographical area covered by the spreading epidemic. As the epidemic grows in space, the associated convex hull also grows in time.

