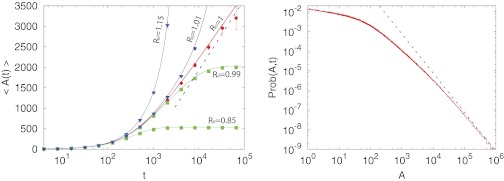
Fig. 2.

(Left) The average area 〈A(t)〉 of the convex hull as a function of the observation time. For the parameter values, we have chosen D = 1/2 and b = R0γ = 0.01. We considered five different values of R0. We have obtained these results by two different methods. (i) One method is by the numerical integration of Eqs. 9 and 14 and using Eq. 15. These results are displayed as solid lines. (ii) The other method is by Monte Carlo simulations of the 2D branching Brownian motion with death with the same parameters averaged over 105 samples. Monte Carlo simulations are displayed as symbols. The dashed lines represent the asymptotic limits as given in Eq. 2 for the critical case R0 = 1. Additional details of the numerical simulations are provided in SI Text. (Right) Distribution of the area of the convex hull for the critical case R0 = 1, with γ = 0.01 and D = 1/2, as obtained by Monte Carlo simulations with 2 × 10⁶ realizations. The dashed line corresponds to the power-law (24πD/5γ)A−2 as predicted by expression 20.
