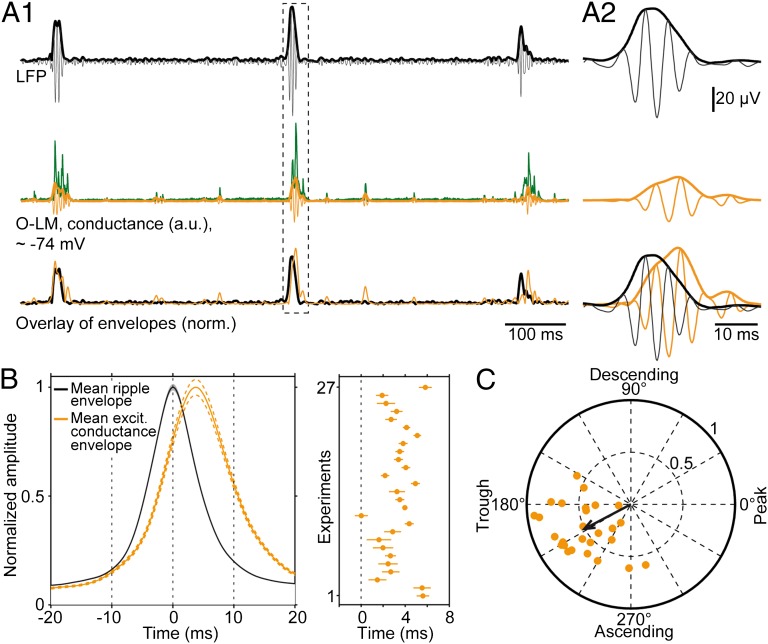
Fig. 2.
Synaptic input onto O-LM cells is coherent with ripples. (A) Illustration of the analysis. (A1) (Top) Ripple (127–300 Hz bandpass-filtered LFP, black) overlaid with the envelope (black, bold) derived from the Hilbert transform. (Middle) Input conductance (green), its bandpass-filtered version (orange) and the corresponding Hilbert envelope (orange, bold). (Bottom) Overlay of normalized envelopes of LFP and excitatory conductances. (A2) Magnification of the highlighted period. (B Left) Average envelopes of ripples (black) and excitatory conductances (orange) of 27 cells. The average excitatory input conductance in O-LM neurons lags behind the field ripples by 3.3 ± 0.3 ms. (Right) The orange dots represent the time points of conductance envelope peaks for all 27 cells (range: 0 ms to 5.8 ms). (C) Phases of excitatory conductances with respect to LFP ripples for 27 O-LM cells; orange dots represent the strength and phase of single-cell vectors (black circles and numbers, vector strength scaling; average vector: 208° with a vector strength of 0.51). Across cells, the analysis reveals a strong locking to early ascending ripple phases (mean phase estimation error: 27.1 ± 1.5°; SI Materials and Methods, Data Analysis).

