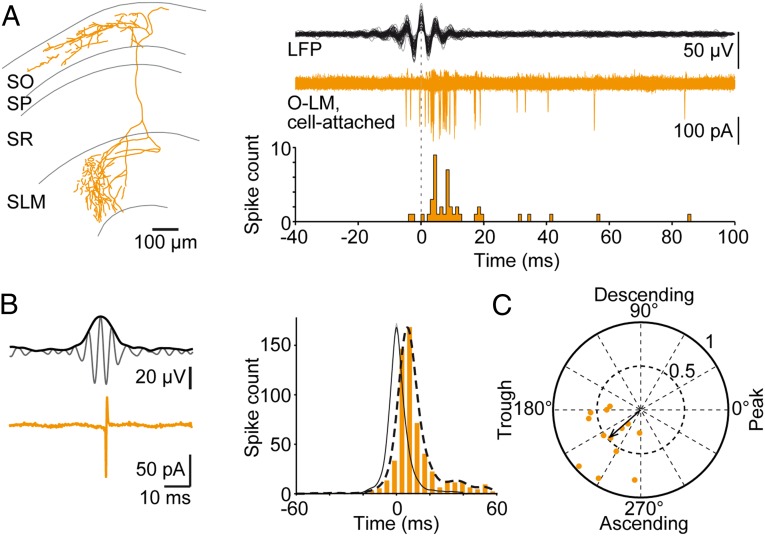
Fig. 3.
O-LM cells discharge during SWRs, and spikes are phase-locked to ripple oscillation cycles. (A Left) Reconstruction of an O-LM neuron. (Right) Overlaid traces of 87 bandpass-filtered (127–300 Hz) ripple episodes (Top, black) and respective cell-attached signals recorded from the displayed neuron (Middle, orange); all traces were aligned to the ripple maximum (dotted line). (Bottom) Spike time histogram of action-currents demonstrating delayed activation of the cell and ripple-locked discharge. (B Upper Left) The 127–300 Hz bandpass-filtered LFP overlaid with its envelope. (Lower Left) Simultaneously recorded action-currents from the recording shown in A. (Right) The spike-time histogram (orange) includes all action currents obtained from 13 cell-attached recordings with respect to the peak of each corresponding ripple envelope (average, solid black line; arbitrary units). Overlaid histogram profile (dashed line) represents the sum of Gaussians (σ =3.7 ms) centered on the spike times. Spikes occur late during ripples. (C) Polar phase plot indicating average firing phases for the 13 cells recorded in the cell-attached mode (single-cell phase vector tips and vector strength, orange dots); the arrow represents the average vector (221° with a vector strength of 0.47). Note that spike phases cluster to the early ascending phase of ripples.

