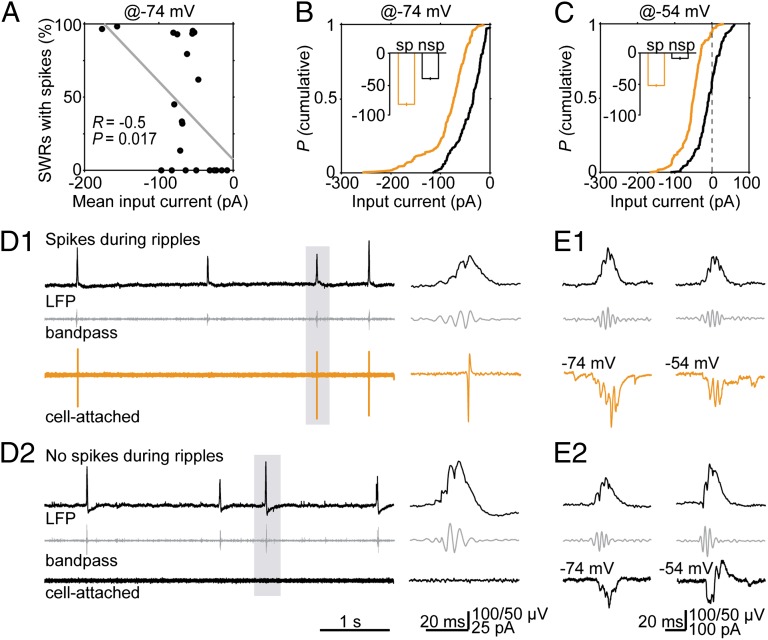
Fig. 4.
The magnitude of input currents determines the recruitment of O-LM neurons during ripples. (A) The spiking probability of O-LM cells during SWRs is correlated to their mean input current (R = −0.5; P = 0.017; n = 22 experiments). (B) Cumulative probability of the average input current in O-LM cells held at −74 mV for spiking (orange) and silent cells (black). Quartiles of spiking cells: Median: −72.9 pA, P25: −93.8 pA, P75: −53.7 pA; quartiles of nonspiking cells: Median: −33.8 pA, P25: −59.1 pA, P75: −19.3 pA. (Inset) The mean values (sp: spiking; nsp: nonspiking or silent). (C) Distributions of average input currents for spiking (orange) and silent (black) O-LM neurons held at −54 mV. Quartiles of spiking cells: Median: −49.2 pA, P25: −66.6 pA, P75: −33.5 pA; quartiles of nonspiking cells: Median: −8.2 pA, P25: −27.4 pA, P75: 12.1 pA. The inset shows the means values. (D Upper) Unfiltered LFP. (Middle) 127–300 Hz bandpass-filtered LFP. (Lower) Cell-attached recording of a spiking (Upper, D1, orange) and of a nonspiking O-LM cell (Lower, D2, black). (Right) Magnifications of the highlighted events. (E Top) Unfiltered LFP. (Middle) Bandpass-filtered LFP. (Bottom) cPSCs of a spiking (E1, orange) and a nonspiking O-LM cell (E2, black) close to the reversal potential of Cl− (−74 mV, Left) and at −54 mV (Right).

