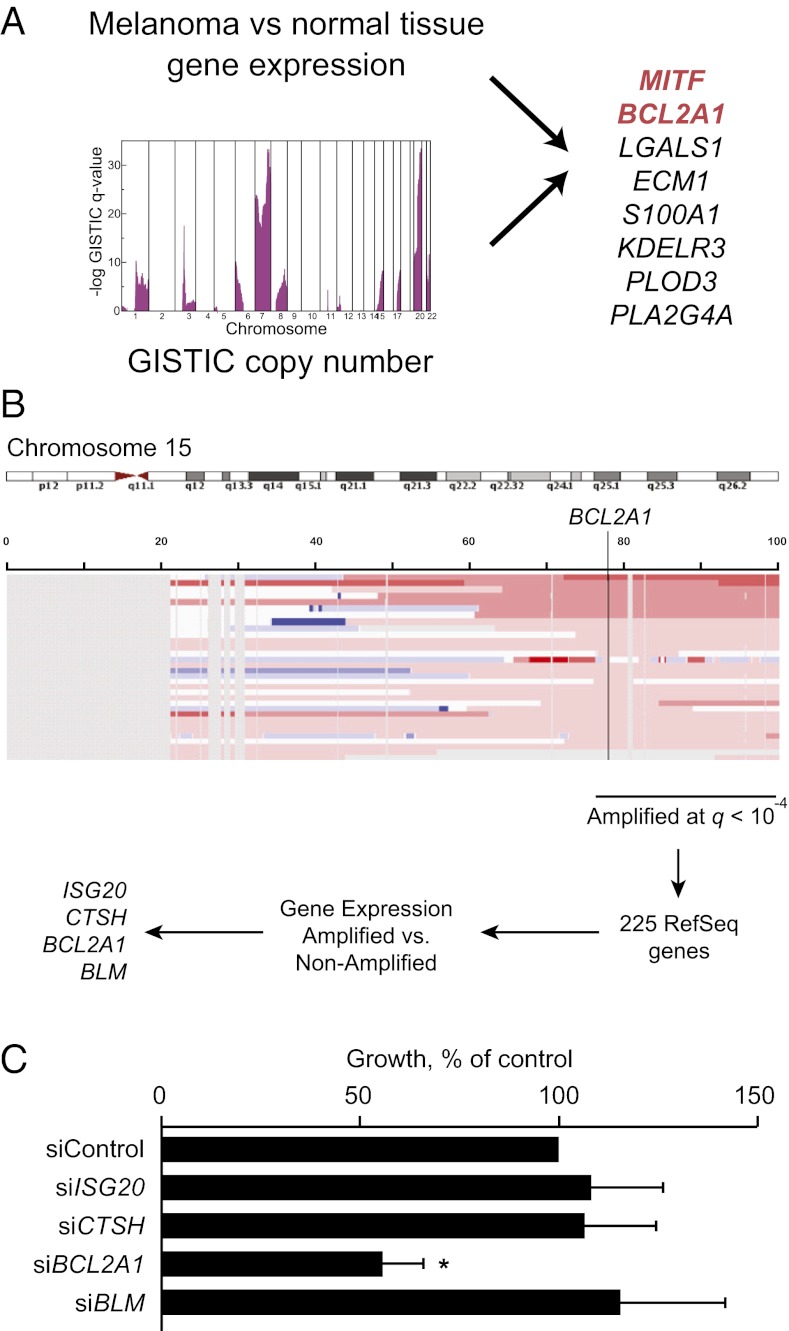
Fig. 1.
Scheme for identification of unique amplified oncogenic targets. (A) Diagram showing intersection of amplified genes that were significantly increased in melanoma compared with pooled normal tissues. (B) Approach for identification of oncogenes located on chromosome 15q. Eighty-eight melanomas with copy number analysis and gene expression were analyzed by GISTIC analysis and filtered for higher expression in 15q-amplified versus nonamplified melanomas (P < 0.05, Wilkcoxon test). (C) Dependence of M14 melanoma cell line on BCL2A1 and other candidate genes located in the 15q amplicon. M14 cells were transfected with siRNA targeting BCL2A1 or control. Colony formation is normalized to control siRNA 72 h after transfection. Data represent an average of at least six independent experiments with reported SE. *P < 0.05 versus siControl.

