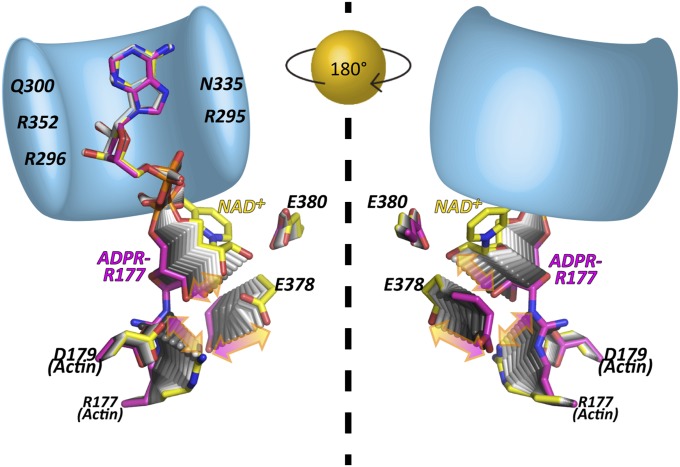
Fig. 3.
Transient structures of the prereaction state [NAD+-Ia-actin (yellow)] and the postreaction state [Ia-ADPR-actin (magenta)]. Schematic presentation of Ia (bright blue: R295, R296, Q300, N335, and R352 are labeled) gripping the ADP moiety of NAD+ or ADPR. The Right panel is a back view of the Left panel.

