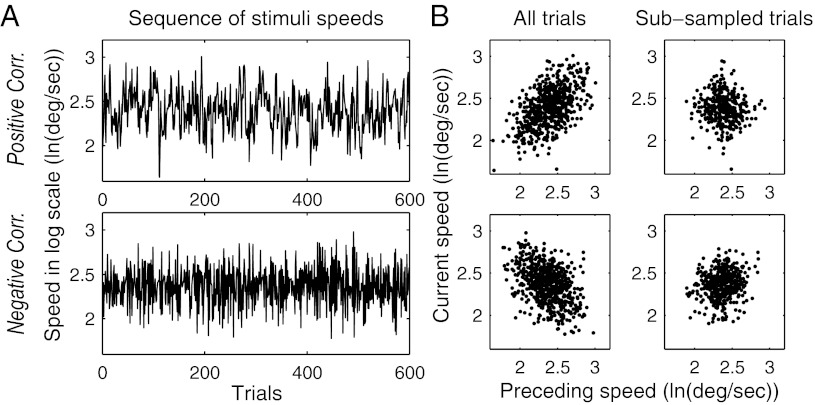
Fig. 3.
Speeds of stimuli for experiment 2. (A) Example sequences of target speeds in each of the conditions. (B) Scatter plots of stimulus speeds for pairs of temporally adjacent trials (in the first case, including all pairs and in the second case, including pairs that had equivalent joint statistics in the two correlation conditions).

