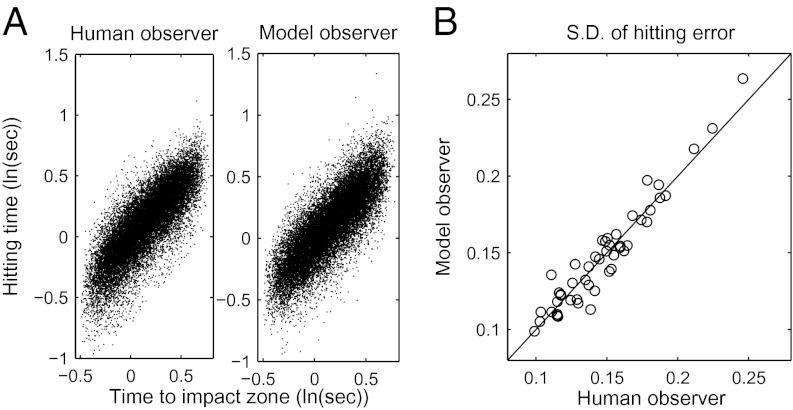
Fig. 5.
Variability in the model and human observers’ performance. (A) Scatter plots of the hitting time on each trial as a function of the stimulus-specified time to impact zone for both model and human observers. (B) SD of the timing errors for the model observers against the SD of the timing errors for the matched human subjects.

