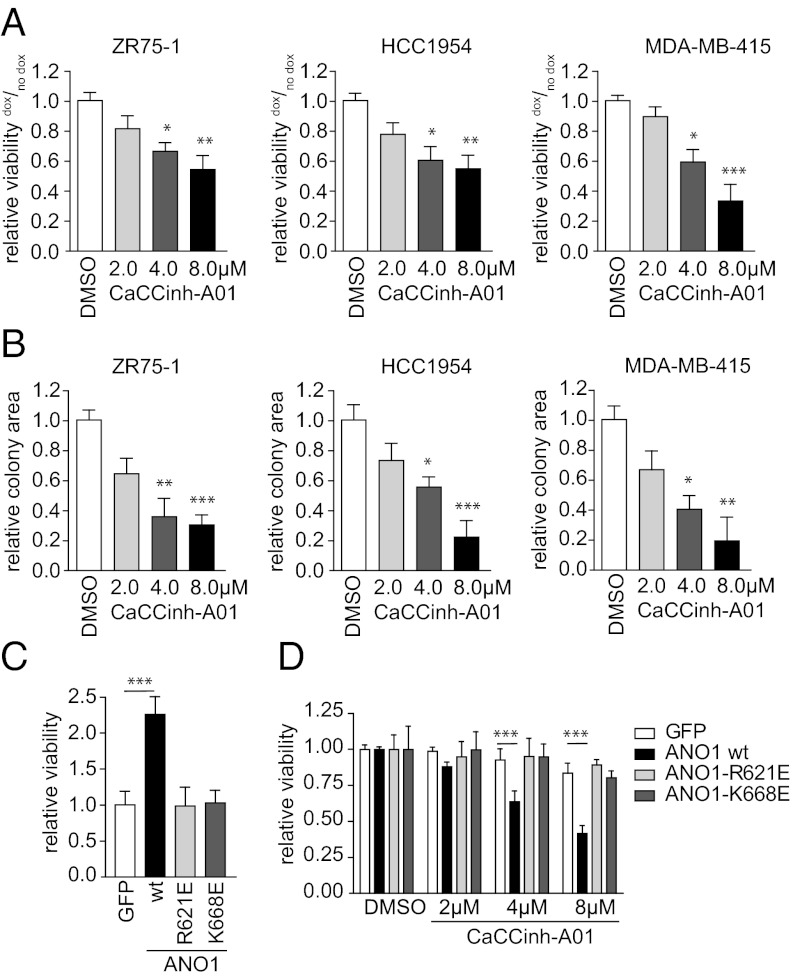
Fig. 3.
Inhibition of ANO1 function decreases breast cancer cell viability and colony formation. (A and B) Bar graphs showing relative viability (A) or colony formation (B) of breast cancer cell lines after inhibition of ANO1 with CaCCinh-A01. Data were normalized to the respective DMSO-treated samples. Data are expressed as mean ± SEM; n = 5. (C) Bar graphs showing relative viability of MCF10A cells stably transfected with wild-type ANO1, the pore-mutants ANO1-R621E, or ANO1-K668E, respectively. Data were normalized to the GFP control vector cell line. Data are expressed as mean ± SEM; n = 5. (D) Bar graphs showing relative viability of MCF10A modified as in C after treatment with the indicated concentrations of CaCCinh-A01. Data were normalized within the same cell line to the DMSO-treated cells. Data are expressed as means ± SEM; n = 5. *P < 0.05; **P < 0.01; ***P < 0.001.

