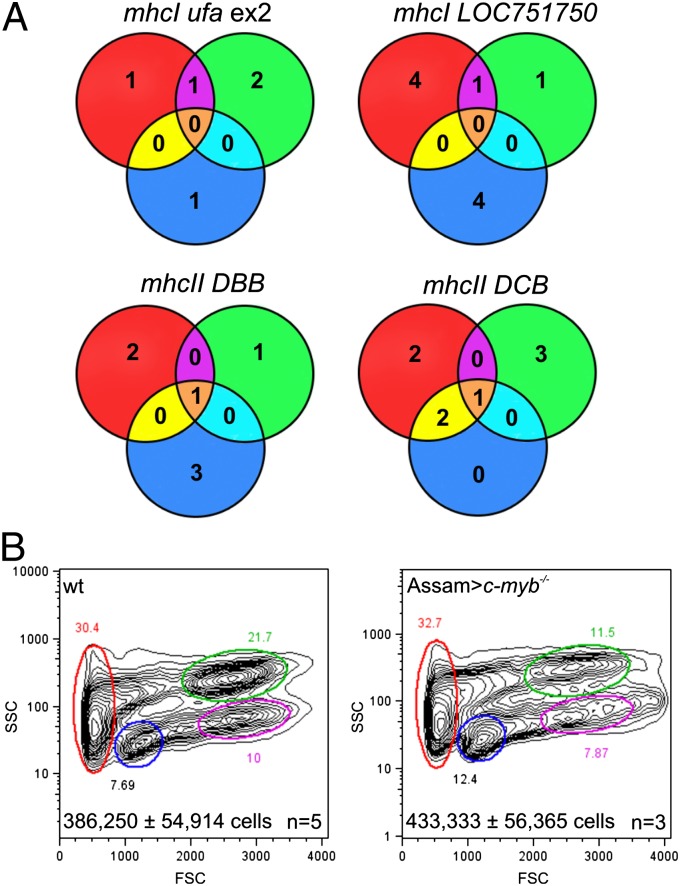
Fig. 4.
Allogenic hematopoietic cell transplantation. (A) Analysis of allelic diversity of mhcI and mhcII genes in c-myb−/− mutants (red circles), Tg(ikaros:eGFP) wild-type fish (green circles), and Assam wild-type fish (blue circles). The Venn diagrams indicate the extent of overlap as determined by nucleotide sequences of the relevant parts of the indicated mhc genes (see Table S1 for primer sequences and Fig. S3 for protein sequence comparisons). (B) Flow cytometric analysis of WKM of wild-type and c-myb−/− mutants reconstituted with WKM cells of the Assam strain, 9 wk after transplantation (see Fig. 1E legend for explanation of indicated cell populations); representative profiles are shown. Total cell numbers (mean± SD) in WKM preparations are indicated.

