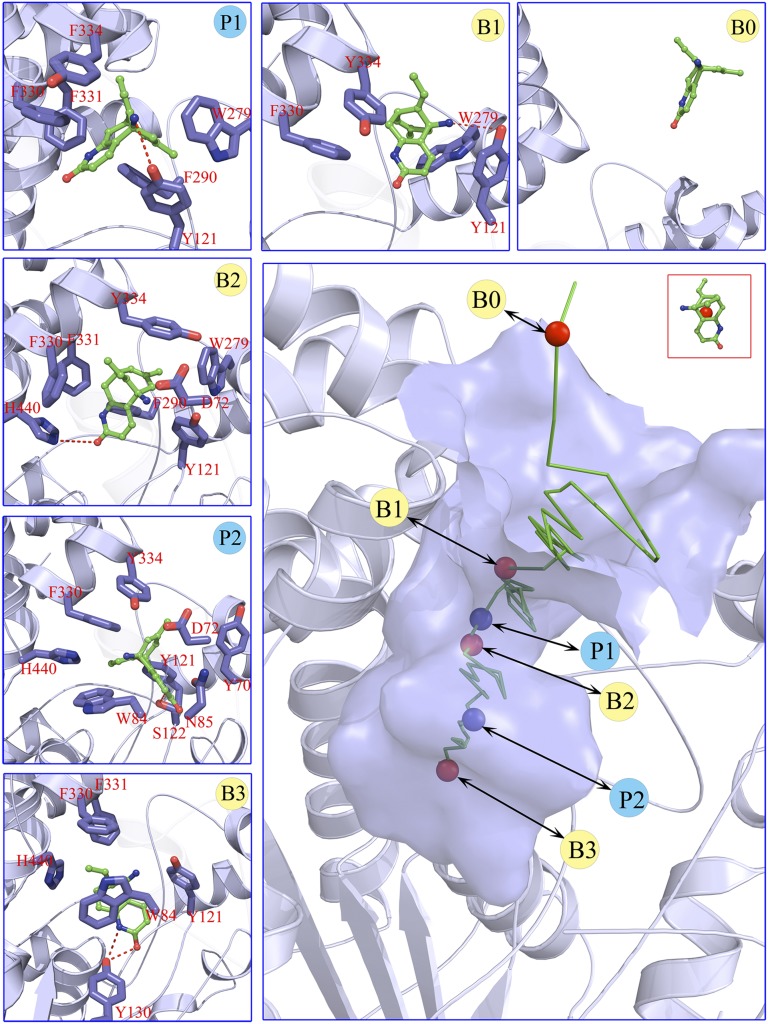
Fig. 4.
Structural features along the most possible binding pathway of HupA entering the gorge of TcAChE. (Lower Right) The binding pathway of HupA to TcAChE corresponding to the binding free energy profile shown in Fig. 2B. Green stick reflects the lowest-binding free energy pathway portrayed by the centers of mass of the instantaneous configurations of HupA. Circles highlight the (meta)stable states (red) and transition states (blue). Smaller panes (Upper and Left) represent the interaction models for the metastable, stable, and transition states indicated in the binding pathway. Red dashed lines in structural models indicate the hydrogen bonds.

