Fig. 4.
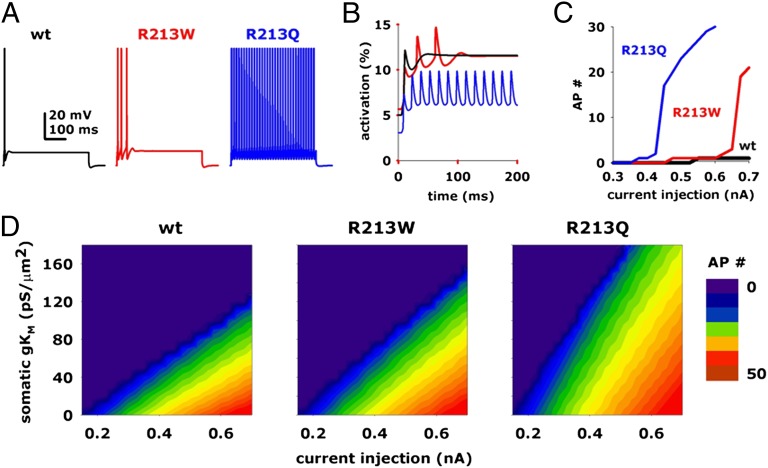
Modeling of the effects of the KV7.2 R213W (R6W) and R213Q (R6Q) mutations on neuronal excitability. Time courses of the somatic membrane potential (A) and of the activated conductances (B; only the first 200 ms are shown) from CA1 neurons expressing KV7.2+KV7.3 (black traces), KV7.2+KV7.2 R6W+KV7.3 (red traces), or KV7.2+KV7.2 R6Q+KV7.3 (blue traces) heteromeric channels, during a 500-ms somatic current injection of 0.65 nA. (C) Input/output (I/O) curves from cells expressing KV7.2+KV7.3 (black trace), KV7.2+KV7.2 R6W+KV7.3 (red trace), or KV7.2+KV7.2 R6Q+KV7.3 (blue trace) heteromeric channels. Number of APs (AP#) is expressed as a function of the somatic current injected, using a 120 mS/μm2 peak IKM conductance. (D) Contour plots for number of APs elicited by a 500-ms somatic current injection from cells expressing KV7.2+KV7.3, KV7.2+KV7.2 R6W+KV7.3, or KV7.2+KV7.2 R6Q+KV7.3 heteromeric channels as a function of current injection and peak IKM conductance.

