Fig. 3.
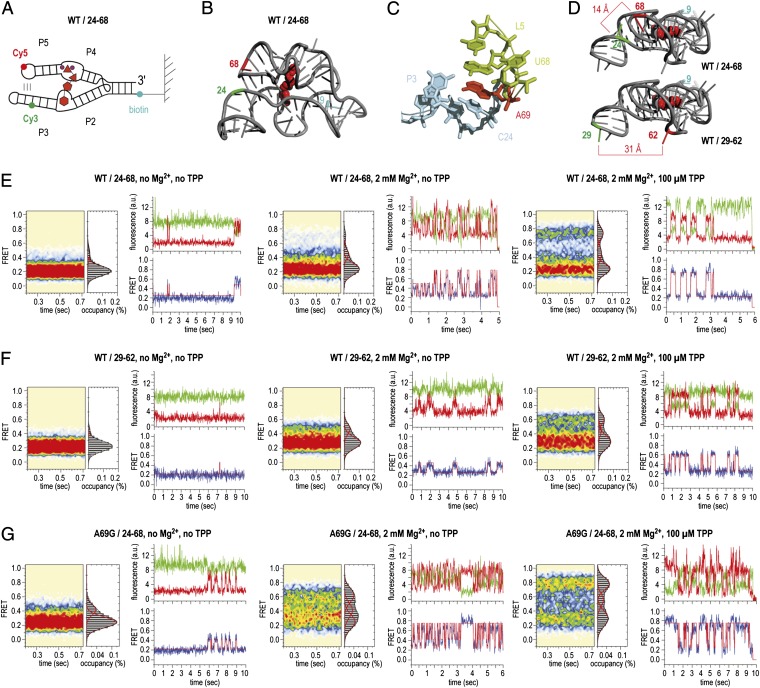
Dynamics of sensor arms P2/P3 and P4/P5 of the TPP aptamer analyzed by smFRET experiments. (A) Schematics of labeling pattern. (B) Positions of labeling in the 3D structure (WT/24–68). (C) Local environment of the interdomain stacking interaction of A69 to C24. (D) Comparison of distances between labeling positions in WT/24–68 and WT/29–62. (E) Population FRET histograms showing the mean FRET values and percentage (%) of occupancies of each state observed for the TPP aptamer and corresponding fluorescence (green, Cy3; red, Cy5) and FRET (blue) trajectories of individual aptamer molecules in the absence of Mg2+ and TPP ligand (Left), in the presence of 2 mM Mg2+ ions (Center), and in the presence of 2-mM Mg2+ ions and 100 μM TPP (Right); labels attached to positions 24 and 68 of the wild-type (WT) TPP aptamer (WT/24-68). (F) Same as E but with Cy3 and Cy5 attached to positions 29 and 62 in forearms P3 and P5 (WT/29–62). (G) Same as E but with an A69G mutant riboswitch (A69G/24–68).

