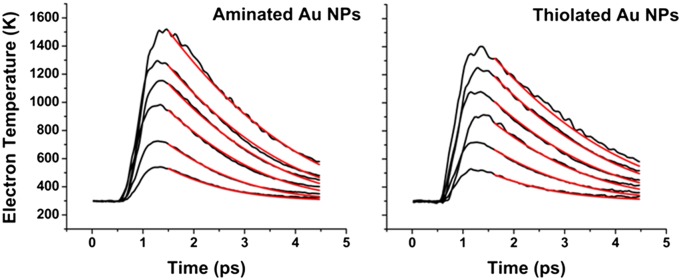
Fig. 4.

Plot of electronic temperature versus time for several values of 〈N〉 (0.5–5) for aminated Au NPs (Left) and thiolated Au NPs (Right). The red lines show the best fits of these traces to the general form of the 2TM (Eqs. 2 and 3) using g = g0 + g1(Te – TL). Table 1 lists the values of g0 and g1 extracted from these fits.
