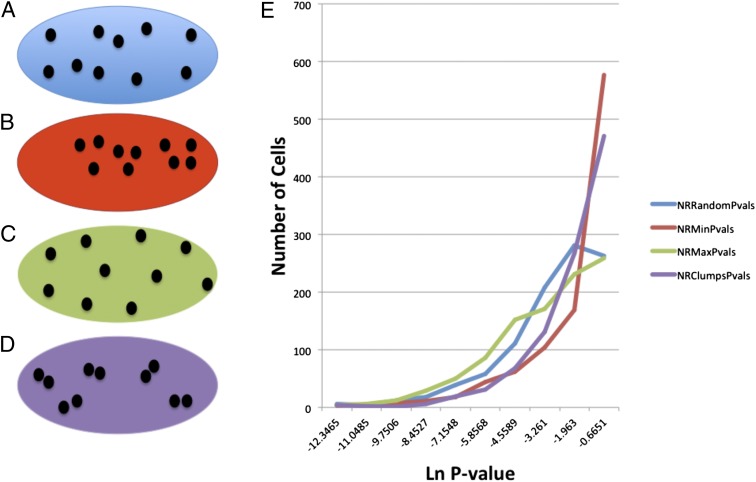
Fig. 3.
Examples of different kinds of organization and the distribution of P values that each type of organization creates with repeated simulations in a single example cell. (A) Uniform distribution of points within the cell. The cell with the minimum interorganelle distance from among 1,000 random cells (B), the cell with the maximum interorganelle distance from among 1,000 random cells (C), and the cell in which points are placed in pairs, with the position of the pairs being uniformly distributed (D), are illustrated. (E) Frequency vs. Ln (P value) curves for each type of simulation. Ln, natural logarithm; NRClumpsPvals, distribution of cells placed in a nonrandom clumped pattern; NRMaxPvals, distribution of cells placed in a nonrandom distance maximized pattern; NRMinPVals, distribution of cells placed in a nonrandom distance minimized pattern; NRRandomPvals, distribution of cells placed in a random pattern.

