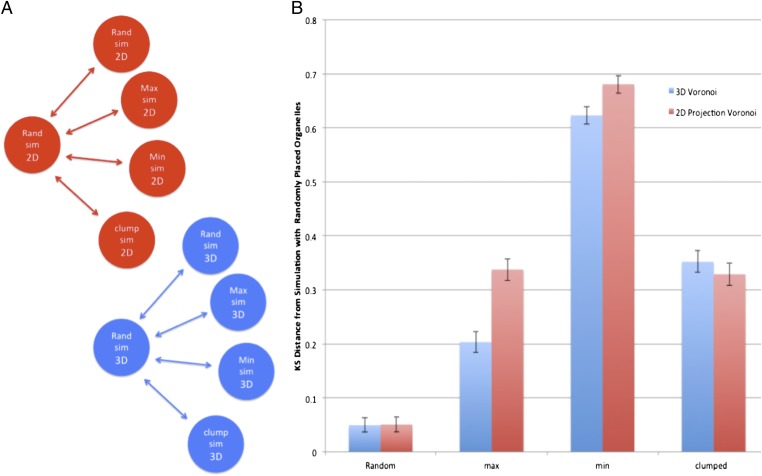
Fig. 4.
Simulated results demonstrate applicability of the method in both two and three dimensions. (A) Network diagram of the distance measurements in B. (B) Comparison of distances obtained using different organizational parameters of cells with full 3D simulations and those obtained using the 2D projections of the same 3D data. max, maximum; min, minimum; rand, random; sim, simulation.

