Fig. 6.
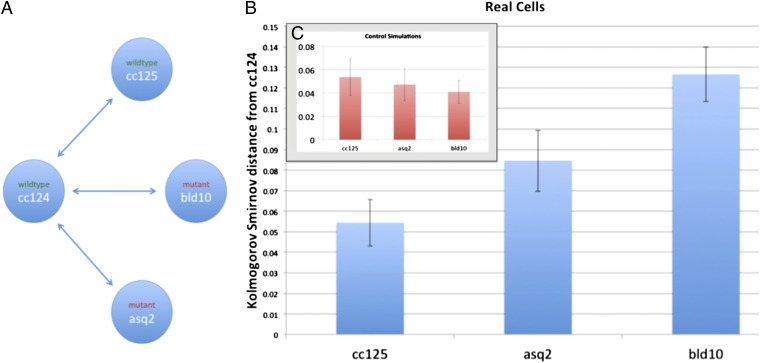
Analysis of organization in mutants with defects in centrioles. (A) Network diagram illustrates the comparisons shown in B and C. (B) KS statistical distance from populations of cc125 (WT), asq2 (mutant), and bld10 (mutant) cells to a population of cc124 cells (in blue). Identically sized samples were taken from several size and area bins for each cell line. (C) Same statistical distance measure is applied to simulated versions of the same four strains with randomly placed organelles. These simulated cells had the same parameters as the WT cells, but the locations of their organelles were drawn from a uniform random distribution within an ellipsoid. This result indicates that the real distance between the two WT populations, cc125 and cc124, is indistinguishable from that of statistically identical populations in the same cells. In contrast, it appears that both mutants, asq2 and bld10, are significantly distant from WT cc124, indicating a different underlying organizational distribution.

