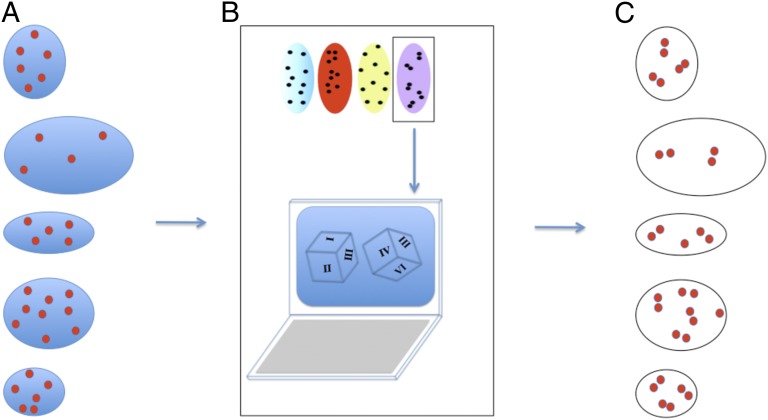
Fig. 7.
Schematic description of simulations that test the effect of differences in real cell size and shape on outcomes of organizational difference tests. (A) Segmented data from real cells defining the number of organelles and the boundary of the cell are the starting point for creating the real cell simulations. (B) For each cell, the number of organelle points in the real cell is replaced based on the type of organizational distribution desired. (C) Each real cell in the dataset is replaced with a simulated cell, with the only difference being that the placement of the organelles is now in the simulated pattern (placed in pairs in the case of this example).

