
Fig. 3.
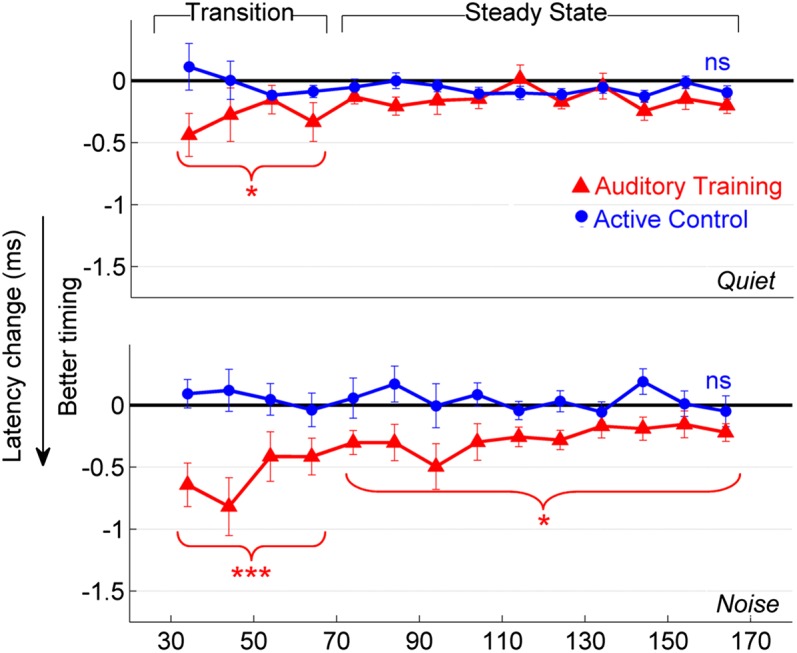
Changes in the neural response to [da] for peaks occurring every 10 ms (corresponding to the 100 Hz pitch of the stimulus) are displayed for the auditory training (red; n = 35) and active control (blue; n = 32) groups in quiet (Upper) and noise (Lower). The brackets indicate the transition and steady-state regions of the [da]. Improvements in timing were noted in the auditory training but not in the active control group. *P < 0.05, ***P < 0.001; Error bars: ±1 SE.